
Learn how to setup and use Hotjar’s analysis tools to understand your site visitors
Heatmaps
Website heatmaps visualize the most popular (hot) and unpopular (cold) elements of a webpage using colors on a scale from red to blue.
By aggregating user behavior, heatmaps facilitate data analysis and give an at-a-glance understanding of how people interact with an individual website page—what they click on, scroll through, or ignore—which helps identify trends and optimize for further engagement.

What can I get out of it?
Heatmaps help you understand how people interact with your website pages, so you can find answers to business-critical questions such as ‘why are my users not converting?’ or ‘how do I get more visitors to take action?’ Using heatmaps, you can determine if people are:
- Reaching important content or failing to see it
- Finding and using a page’s main links, buttons, opt-ins, and CTAs
- Getting distracted by non-clickable elements
- Experiencing issues across devices
As a visual tool, heat maps help you make informed, data-based decisions for A/B testing, updating, or (re)designing your website. And they are also useful on a wider business scale: heat maps let you show team members and stakeholders what’s happening and get their buy-in more easily when changes are needed—it’s hard to argue with a heat map!
Types of Heatmaps available
Click Maps
Click maps show you an aggregate of where visitors click their mouse on desktop devices and tap their finger on mobile devices (in this case, they are known as touch heatmaps). The map is color-coded to show the elements that have been clicked and tapped the most (red, orange, yellow).

Scroll Heatmaps
Scroll maps show you the exact percentage of people who scroll down to any point on the page: the redder the area, the more visitors saw it.
Move Maps
Move maps track where desktop users move and pause their mouse as they navigate the page. The ‘hot’ spots in a move map represent where users pause their mouse, and research suggests a correlation between where people are looking and where their mouse is—meaning that a move map gives you an indication of where people might be looking as they go through your page.

Create a heatmap in 5 steps with Hotjar
Step 1: get started
Start creating your first heatmap by clicking on the ‘NEW HEATMAP’ button:

Step 2: name your heatmap
Give your heatmap a memorable name (like Homepage, Pricing Page, or Homepage v2 November) so you know exactly what page you are tracking:

Step 3: customize your pageviews
Select how many pageviews you want to capture in your heatmap:

Step 4: select the target page(s)
Choose which page(s) you want the heatmap to capture (don’t know where to put your heatmap? Keep reading to the end of this chapter):

You can set your Heatmap to target visitors on a specific page or one of multiple similar pages. If you have our Business plan, you will also be able to setup your Heatmap to only capture interactions when visitors trigger a JavaScript snippet.

If you wish to gather data from multiple pages, select the Starts with, Ends with, Contains or Regular expression match type. You can then optionally enter a Screenshot Page URL that will determine which page the screenshot will be taken of.
Step 5: set your heatmaps live
Review your configuration, save it, and set your heatmap live:

Once you add a Heatmap to Hotjar, it will appear in your Heatmaps list:

Hotjar Heatmaps currently have a few limitations, such as not being able to include dynamic content in the screenshot. See the short list of limitations here.
What your heat map data will look like
Once your heatmap is live, you need to wait for people to visit your page so Hotjar can start recording their clicking, tapping, swiping, and scrolling behavior.
It only takes one person to visit the page for Hotjar heatmaps to start working—but of course, data based on just one visitor might not be very useful.
As more and more data gets recorded, Hotjar generates the heatmap visualization for the page. From within the interface, you can toggle between the three types of heatmap—click map, move map, and scroll map—and also select the device you’d like to see a heat map report for:

You can also download a spreadsheet with a full breakdown of clicks by HTML element and scroll data from the top to measure your efforts:

In addition to the at-a-glance understanding that you will get from your heatmaps, these rows of data are there to help you design pixel-perfect user experiences; for example, you and your UX design team can easily refer back to the data to find exactly where you need a CTA to capture users’ attention on desktop and mobile.
Pages to collect heat map data on
Heat maps allow you to take a deeper dive into any of your website pages, but it makes logical sense to start from the ones that are most important to you in terms of traffic, usability, and business objectives.
1. Homepage and landing pages
Your homepage and main landing page(s) are the main entry points into your website. They are often responsible for your visitors’ first impressions and for their decision to continue browsing or abandon the website. A heatmap on these pages will help you determine how much information gets seen or interacted with, and what elements are being clicked on or ignored.
2. Top pages
Your best-performing pages (the most viewed product page, the most commented blog post, etc.) are obviously doing something right: eye tracking with a heat map can help you understand what is working well, so you can replicate the success elsewhere.
3. Under-performing pages
Your worst-performing pages are as important as the previous ones, but for the opposite reason: there is likely something wrong with them, and placing a heat map there can help you understand what your visitors are (not) seeing or interacting with, so you can take action.
4. New pages
Your newest pages don’t have a lot of data: if you recently added a page to your website, a heat map might be a good way to get some initial information about how the page is performing.
Recordings
In a nutshell, session recordings are renderings of real actions taken by visitors as they browse a website. Recordings capture mouse movement, clicks, taps, and scrolling across multiple pages on desktop and mobile devices.
Also known as session replays, user recordings, and user/visitor replay tools, session recordings are used to gain a real understanding of how users interact with a website, which then helps fix issues, optimize UX, and ultimately improve conversion rate.
What can I get out of it?
Session recordings are one of the best tools in your UX toolbox when you want to see how people really navigate through your website and collect the insight you need to fix the user experience and improve conversions.
Recordings and replays are an extremely powerful tool for gaining insight into how users behave—they are one of the closest things to being in the same room as your users and see exactly how they interact with your site. Here are five of the most popular ways session recordings can teach you more about your customers.
1. Understand and empathize with your visitors’ experience
Putting yourself in your users’ shoes allows you to empathize with them, experience what they’re going through as they browse your website, and build a more enjoyable and efficient user experience as a result. It doesn’t take more than 10-20 recordings to start seeing where visitors are getting stuck—and you may even already spot what’s persuading them to convert.
2. See how users interact with specific website elements
Session recordings let you really zoom in on how users interact with key elements on your website. Where users focus, what they click on, which sections they spend a lot of time on, what they skip over… recordings allow you to stop speculating about it all and start using real data to make impactful changes.
3. Discover bugs, issues, and obstacles
Watching session replays where users get stuck, confused, and frustrated as they experience issues is one of the fastest ways to improve your website.
Barriers (obstacles that stop a customer from progressing) can be both technical and informational: look out for broken elements and loading issues in addition to misleading micro-copy or unclear instructions.
4. Find out why people are leaving your website
Spot opportunities to reduce bounce rates and keep people on your website by watching session replays from users who left your site without converting. Look for patterns of behavior—did they navigate erratically? Did they miss an important link? Did they encounter a bug? Answer these questions and you’ll know what needs improving.
5. Help team members, clients, and stakeholders make decisions
Recordings are easy to share, straightforward to watch, and provide evidence for getting people onboard before making design decisions and optimizations.
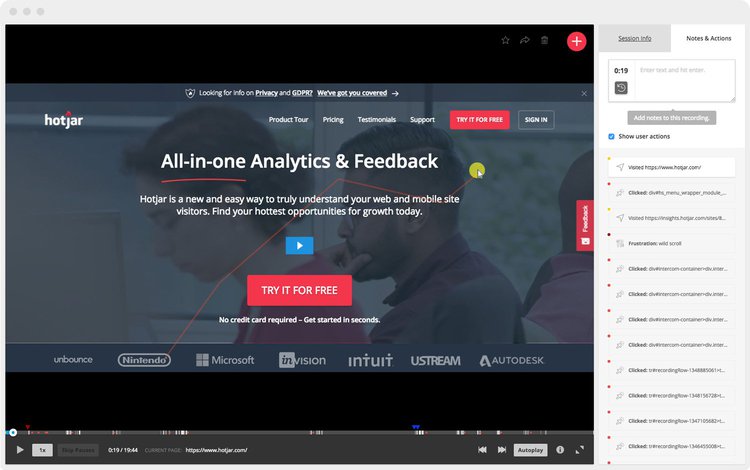
What can you see with session recordings?
Session recordings show you everything a user sees in their browser.
- Record mouse movement, scrolling, and clicks on desktop
- Replay scrolling and taps on mobile
- Multiple page views
- Record keyboard strokes
After the first few recordings, you will probably begin to spot trends in your visitor behavior and the way they interact and engage with your website or app. You’ll start noticing:
- What elements visitors use to navigate from one page to another
- How visitors interact—or fail to—with buttons and clickable elements
- Unusual mouse activity, for example, wild scrolling or repeated clicking
- If it takes too long to complete an action
- How visitors move around on the page and where they stop
You’ll also be able to see problems that need fixing, for example:
- Page(s) that load incorrectly across different devices and/or browsers
- Functionality that doesn’t work like it should (example: log in not working, search bar not returning results)
- Elements that render incorrectly, are missing and/or broken
How to start your recordings
Step 1: From the sidebar menu, select Recordings.
Step 2: Click on the green Record Visitors button.

Step 3: Select the number of Recordings needed in a snapshot.

The snapshot size will determine how many sessions Hotjar will track before it stops Recording. For more information, have a look at our Snapshot explanation.
Step 4: Choose when the Recordings will start capturing visitors.

Recordings can be captured from any page that the Hotjar code is installed on or from a specific page/JavaScript trigger.
In order to start recording on a specific page, you can use our page targeting rules, a URL Regular Expression, or a JavaScript trigger. You can add multiple page targeting options by pressing the ‘+‘ icon.

Once your visitor gets to a page which matches any of these options, Hotjar will start recording until the end of visitor’s session.
Step 5: Turn on/off Recording options.
Recording options help you specify when Recordings will be collected. You can set recordings to activate only when click and scroll activity is detected, only for sessions of 30 seconds and longer, and to record keystroke data.

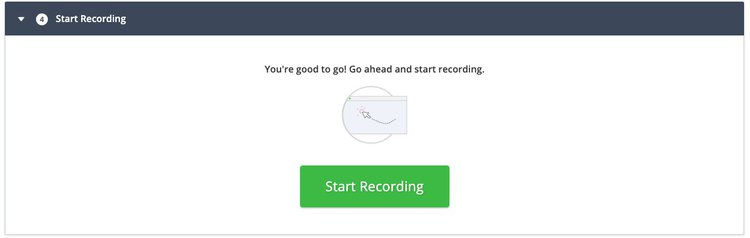
Step 6: Hit ‘Start Recording’ and you’re all set
That’s it: you’re now collecting session recordings! You won’t have to wait long before you can start watching them and finding ways to improve your website.
You will need to wait a few minutes before you start to see data. If you know for a fact that you should have new Recordings but are not seeing any or are seeing incomplete Recordings, check our Troubleshooting article for more information on why this could be happening.
Whitelisting Not Working?
Only certain text fields are allowed to be whitelisted. You can see the list of fields that aren’t able to whitelist here.
Stop Recordings and Edit Settings
- To review and edit the current settings for Recordings, click on the gear and select the Edit Settings button.
- To stop Recordings, click the Pause Recording button. You can then restart a Recording snapshot at any time.

Funnels
Funnel analysis is a method used to visualize and map the flow of visitors across a set of website pages or events. A website funnel gets its name because, much like a physical funnel, it narrows toward the end—so the volume of visitors at the top is larger than the volume of visitors at the bottom.
Funnels (also called conversion funnel or sales funnel) are widely used across various marketing functions because they help identify barriers that cause users to leave before reaching a conversion point.
Funnel analysis tracks how many visitors make it through each step, highlighting problems or areas for improvement in the customer journey with the goal of increasing conversion rates and revenue
What can I get out of it?
1. Find the high-traffic, high-exit pages where people are leaving
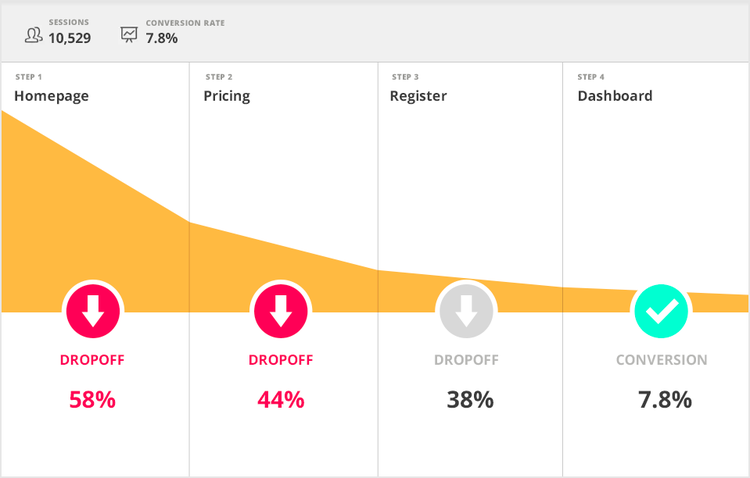
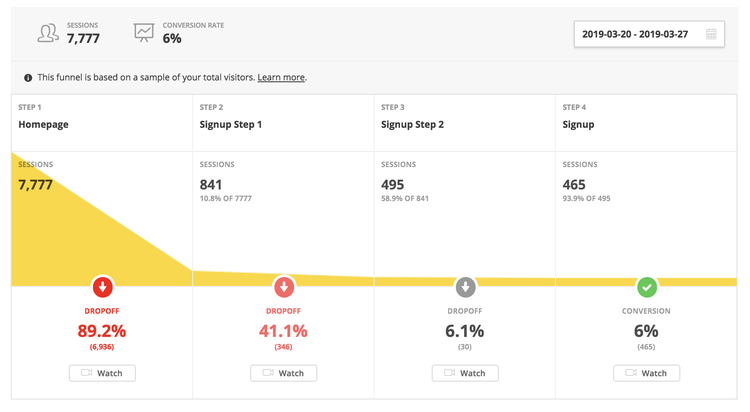
A funnel visualization tool shows the drop-off rate and conversion rate of your main pages, helping you understand when and where visitors and potential customers are leaving your website.
Knowing where in the journey users drop off will help you focus your optimization efforts on the biggest opportunities. To lean on the funnel metaphor: finding where users leave will help you plug holes in your funnel and send more traffic down it.
2. Determine where high-quality visitors come from
Funnels are not only useful for finding issues that need fixing: they can also help you spot successes you can double down on—for example, by revealing where your high-converting traffic comes from.
An advanced funnel visualization tool like Google Analytics will help you do this: you’ll need to set up the goals you are interested in (e.g., cart completion, newsletter signups), and use the Goal Flow feature to filter by source to see where converting traffic came from.
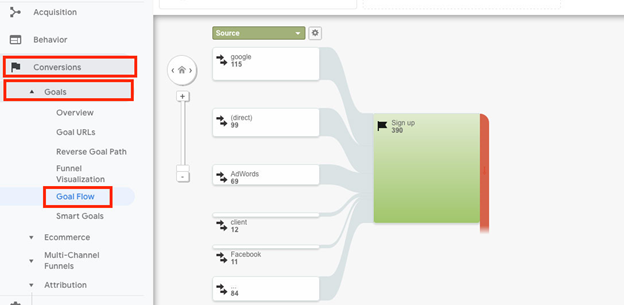
If you understand how visitors who convert reach your website, you can focus more efforts on those acquisition channels and increase the number of likely conversions.
3. Help team members and stakeholders make decisions
Conversion funnels are a straightforward way to share where your business is doing well and where there are opportunities for improvement.
Funnel reports are an easy visual aid to use in presentations to stakeholders and team members, helping you get buy-in for future optimization work and showcase your successful projects. There’s nothing quite like seeing a big red ‘drop-off’ alert to inspire people to take action.
How to set up?
Setting up a funnel in Hotjar is super-easy and takes less than five minutes.
STEP 1: Select “Funnels” from the sidebar menu
Hit the green “NEW FUNNEL” button to get started.

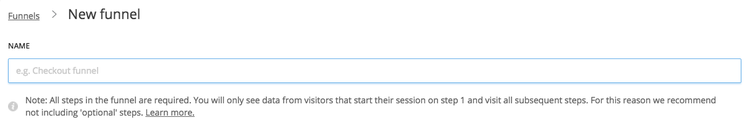
STEP 2: Pick a name for your funnel
STEP 3: Select the pages you want to track
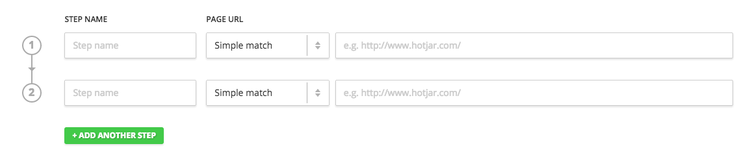
If you’re not sure which pages to track, start by identifying your main goal (e.g., product purchase or email signup), then work backward to your highest trafficked page and include them all in the funnel.
Here are some basic examples to get you started:
- E-commerce sites: homepage > product pages > cart > checkout > thank you page
- Blog: homepage > article pages > subscribe page > success page
- SaaS: homepage > trial signup page > interface > upgrade page > thank you page
- Lead generation: category pages > landing page with form > thank you page
Let’s say you have the following Funnel set up:
A > B > C > D
That means that each of those steps has to be visited in order, although it’s fine if other pages are visited in between. For example, if the above site also has pages E, F, and G, then the following would convert:
A > B > E > C > G > D
E > A > F > B > C > G > C > D
However, if a user skips a step, the conversion won’t happen:
A > B > D
In this scenario, the Funnel drop shows at step B since step C was never visited.
Hotjar allows visitors to visit as many other pages as they want as long as the Funnel steps are all visited in order. Meaning that the visitor can do this, and still be considered a conversion:
A > B > some other page > C > some other page > D
STEP 4: Click “Create Funnel”
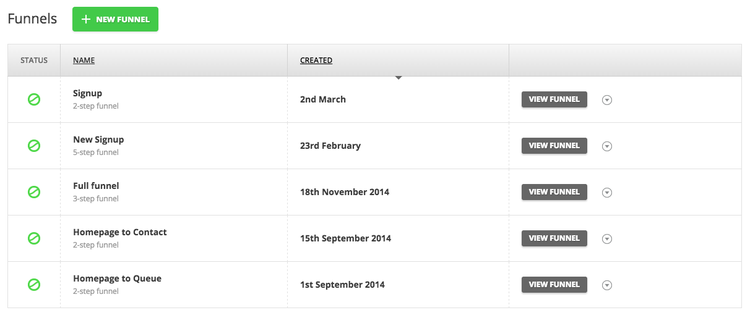
It’s as simple as that. You can set up as many funnels as required and view the visualization by clicking “VIEW FUNNEL.”
Next: as soon as a page has the Hotjar tracking code installed on it, Hotjar is collecting page view information. When you set up (or edit) a new Funnel, Hotjar can backfill the data for you—so you can retroactively look at where your biggest drop-offs are.
🏆 Tip #1: within Hotjar funnels, you can filter results by date range, which is super-useful when you want to see if changes you’ve made have improved your site’s performance.
Rate of Funnel Updates
Once a Funnel has been set up, Hotjar will automatically update your Funnel data once every hour. Since constantly updating Funnel data could potentially slow down the interface and affect your user experience negatively, we instead perform the calculations in the background on an hourly basis, thus ensuring that Funnel data loads instantly and is almost always up-to-date.
If you change any part of the Funnel, Hotjar will instantly re-generate your Funnel data – it may take several minutes before you can see your new Funnel data.
Editing Your Funnel
Updating any URLs, targeting rules or step ordering for a Funnel will cause it to regenerate. Hotjar will only use data from the last 90 days when it is regenerated and traffic older than 90 days will be lost. Therefore, we suggest that you create a copy of your funnel before making changes and then edit the steps in the new Funnel.
Form Tracking
This feature delivers all information regarding the forms hosted on your website, which fields took longer to be filled out, which fields are skipped, and which fields the user gave up on filling out.
This information is critical to determine if your form serves its purpose or if the questions asked there are confusing the user and generating mistrust.
How to create your form?
Step 1. Click on New Form from the Forms section of your Hotjar admin.
Step 2: Select your Snapshot size.
Snapshot size will determine how many sessions Hotjar will track your Form for before it considers the Form Report as complete.
Step 3: Enter the name of your Form and the URL it is on.

Step 4: Click Launch Form Finder.
A pop-window will appear that shows the page you targeted, including a banner that shows you how many forms Hotjar detected on the page.

Step 5: Click on the green Import x forms into Hotjar button.
Step 6: Choose the Form you’d like to track.
If your page has multiple Forms, you will need to select which Form you wish to track. Currently, Hotjar can only track one form per page.

Step 7: Confirm which fields to track.
You can also rename fields and re-order them. The way they are ordered now will determine how they appear in the Form Report later on.

The following Form input field types are supported:
- Text (short)
- Textarea (long)
- “Select” dropdowns
- Checkboxes
- Radio buttons
Once you add a Form to Hotjar, it will appear in your Forms list.

The icon to the left of each Form shows you the status of each Form.

View your Form Report.
Once your Form is running and data is being collected, you can click View Report to see the full Form Report.

Forms do have some limitations
Hotjar Form Reports currently have a few limitations. See Troubleshooting FAQs for Forms for a shortlist of other limitations.
Not seeing your Form Report data?
You will need to wait a few minutes before you start to see data. If you know for a fact that your Form Report should have tracked interactions/submissions but you are seeing no (or incomplete) data, check out Troubleshooting FAQs for Forms for more information on why this could be happening.
How to Read your Form Data
Keep in mind the data shown is from the date the form started to have data tracked by Hotjar. At this time, we do not have date filter available.
Session Count
Session Count is the number of visits to the form as a whole.

Conversion Rate
The Conversion Rate is the percentage of successful form submits.
Conversion Rate is calculated using the formula:
(# of Successful Form Submits / # of Sessions) * 100

Interactions
An Interaction is counted when a visitor clicks, taps or tabs to a field.
The value can only be one per field per session. Multiple clicks, taps or tabs are still counted as one Interaction if they occur in the same session.

Average Interaction Time
Average Interaction Time is the time between the first click, tap or tab on a field – and – click, tap or tab away from the field (.focus() and .blur()).
If a visitor returns (click, tap or tab) to a previously used field the average time continues to be counted from the previous value. The value shown is the average time in milliseconds of all the visits to the page.

Refill Count
The Refill Count is a percentage a visitor re-clicks, taps or tabs to a text field and changes existing content (.focus(), .keypress()).
This value can be more than once per session. Multiple re-clicks, taps or tabs to a field and changes to existing content keeps on incrementing the refill value.
Refill Count is calculated using the formula:
((# of Refills / # of Interactions) * 100)

Left Blank Count
Left Blank Count is the percentage a field is left empty. The count will increase even if there is an interaction with the field.
This value can be more than once per session. Multiple Form submits of a blank field are all counted.
Left Blank Count is calculated by the formula:
((# of Blank Fields /(# of Successful Submits + # of Failed Submits)) * 100)

Dropoff Count
Dropoff Count is the percentage a field is the first to be left empty after the last fill in. If one of the fields was skipped, the dropoff occurs at the very last field that was not filled in, not the field that was skipped.
A fill-in occurs when a visitor enters at least one value, any value, into a given field unique to the session. If a visitor doesn’t fill in any field in the Form the drop off is shown on the first-page step.
If the user successfully submits the Form a dropoff is not calculated.
If all fields have been filled in, but the Form is not submitted, successfully or not, a dropoff is calculated on the last field in the sequence just before they submit.
Dropoff Count is calculated by the formula:
(# of Dropped Off Fields / # of Total Sessions) * 100)

Successful Submit Count
Successful Submit Count is the number of times the page with the form returns a message that the form was successfully submitted.
If you know your Form should have Succesful submits and Hotjar is showing no data, check out Track Form Submission with JavaScript.

Failed Submit Count
Failed Submit Count is the number of times the form returns a message that the form failed to submit out of total submits.
If you know your Form should have Succesful submits and Hotjar is showing no data, check out Track Form Submission with JavaScript.
Dropoff Count is calculated by the formula:
((# of Failed Submits / (# of Succesful Submits + # of Failed Submits) * 100)

Page Targeting
Page targeting options can be found for Heatmaps by selecting either Visit a specific page, Visit one of multiple similar pages or Trigger a JavaScript snippet.

Hotjar’s page targeting rules are:
- Simple match: This is the default match type and is used to target a page on your site, including any query strings and fragments added to the URL. This includes the protocol, http vs. https, and the presence or not of ‘www.’
- Exact match: Targets a specific URL, including the protocol, which can include a query string and fragment.
- Starts with: Target all pages that have a URL, including the protocol, which begins with the entered text.
- Ends with: Target all pages that have a URL that ends in the entered text.
- Contains: Target all pages which contain the entered text. This rule is case sensitive.
- Regular Expression: A regular expression, regex or regexp for short, is a unique text string for describing a search pattern.
Hotjar can only support the following characters:
a-z, A-Z,0-9, -, ., _, and ~. Any other characters need to be percent-encoded.
See more information about page targeting on Hotjar Documentation.