
User Testing Guide
📚 Manage Planet 4 > Information Architecture > User Research Methods

User Interviews
Conducting one-on-one interviews with users allows you to dive deeper into their experiences, preferences, and pain points related to the website. Open-ended questions can help uncover valuable qualitative insights that may not emerge through other testing methods.
QUALITATIVE TEST
💖
🧍♀️
3-8 users
⏰
25-50 hours
Qualitative or Quantitative?
Qualitative
When might you conduct user interviews?
Discovery phase, prototype testing, post-launch evaluation
How many participants are needed?
In qualitative research, the sample size is often determined by the point at which saturation is reached.
Typical ‘rule of thumb’ is 3-8 participants, but it really depends on your resources, objectives, and project complexity.
See more information here.
How long does it take?
This is dependent on several factors, but it’s estimated to take between 25-50 hours spread across week(s). (Please note: this is an estimate. This approximation is thought to be part-time considering that some tasks may also require waiting periods, i.e. recruiting participants).
– Planning and Recruiting: 10-15 hours
– Conducting Interviews: 10-20 hours
– Analyzing Data: 5-15 hours
Grand Total Estimate
— Minimum: 25 hours
— Maximum: 50 hours
Useful tools:
– Maze (recruit users)
– Hotjar (recruit users)
– Looppanel (transcribe interviews)
Resources:
– Planning Resources (Potentially a planning document, project management tools)
– P4 User Interview Guide
– Virtual meeting platform (unless doing in-person)
– Analysis tools (depends what/how you choose to analyze)
Links:
For NROs wishing to take part in the Planet 4 project on User Personas, read more about the project and find the User Interview Guide here.
Steps:
1. Define Your Objectives: Start by clarifying what you want to learn from the interviews. What specific information or insights are you seeking? Are you exploring user needs, pain points, or preferences?
2. Recruit Participants: Find people who represent your target users. Aim for a diverse group to get a range of perspectives. You can recruit in various ways, including through your website (see more info here), through email lists, and more.
3. Prepare Interview Questions: Develop a set of open-ended questions to guide the conversation. Start with broad, introductory questions, then get into more specific topics related to your objectives. Avoid leading questions that might bias the responses.
4. Choose the Right Environment: Select a quiet, comfortable space for the interviews. If conducting remote interviews, ensure that you have a reliable video conferencing tool and a distraction-free environment. Make sure participants feel at ease and can speak freely.
5. Conduct the Interview: Begin by introducing yourself and explaining the purpose of the interview. Encourage participants to share their thoughts and experiences openly. Use your prepared questions as a guide, but be flexible and allow the conversation to flow naturally. Take notes or record the interview (with permission) for later reference.
6. Listen Actively: Pay close attention to what participants are saying, as well as their tone of voice, body language, and any non-verbal cues. Ask follow-up questions to clarify or explore interesting points further. Let participants do most of the talking, and avoid interrupting or imposing your own opinions.
7. Debrief and Reflect: After each interview, take some time to reflect on what you’ve learned. Review your notes and consider any themes or patterns that emerge across interviews. Think about how the insights align with your objectives and what implications they may have for your website.
8. Analyze and Synthesize Findings: Once you’ve completed all the interviews, analyze your notes and identify key takeaways. Look for common themes, trends, or pain points that can inform your decision-making. Consider organizing your findings into categories or themes to make them easier to understand and communicate.
9. Create actionable insights: From your analysis, uncover actionable insights that can drive meaningful change or improvements in your website. Share your findings with relevant stakeholders and team members. Prioritize these insights based on their potential impact and feasibility.
10. Iterate and Learn: User interviews are an ongoing process, so continue to seek feedback from your target audience as you develop and refine your website. Incorporate the insights you gain into future iterations, and be prepared to adapt your approach based on what you learn.
Example:
While not specifically related to the IA & Nav project, our Planet 4 team conducted user interviews with a range of people to explore more about who our frontend and backend users are and what challenges and opportunities exist. Read on to learn more about what we did to see how something similar could be done with your frontend users.
What we did
As part of an ongoing user persona project, the Planet 4 team sent out a survey to better understand the Planet 4 community. We received 28 responses and decided to explore their insights further through user interviews.
Why we used this test
The aim of conducting interviews with Planet 4 users was to get a better understanding of their needs, preferences, goals, and challenges and specifically to dive deeper into their responses from the survey. The purpose was to understand this in the context of their Planet 4 use, but also to learn who our backend users are outside of Greenpeace when they aren’t working (what are their hobbies, interests, etc.). This type of test allowed us to gain deeper insight and provide context to their survey results.
How we tested
After analyzing the survey results, our next step involved identifying which survey respondents should be selected for interviews. This selection process considered factors such as their survey responses (and subsequently those we wanted to dig further into), their geographic location, their position within Planet 4 and time with Planet 4, ensuring a diverse and representative mix of participants.
The interview questions were designed to explore general topics relevant to all participants, with tailored follow-up questions based on their specific survey answers. These questions covered aspects of their personal and professional lives, their roles at Greenpeace, and their experiences and goals related to using Planet 4, providing a comprehensive view of each person’s interaction with the platform.
Findings
We learned so much from these interviews and along with our other research methods, used these insights to help inform several of our backend user personas. We found that many are juggling many tasks at once, they largely all want to bring in more audiences, and some feel that WordPress/Planet 4 is easy to understand whereas others feel it is very challenging.

Usability Tests
Observing users as they interact with your website allows you to identify usability issues and understand navigation patterns. Usability testing can be conducted in-person or remotely, using tools such as screen recording software and remote testing platforms.
QUALITATIVE TEST
💖
🧍🏿♂️
3-8 users
⏰
35-65 hours
QUANTITATIVE TEST
🧠
🧍🏿♂️
20+ users
⏰
35-65 hours
Qualitative or Quantitative?
Qualitative, quantitative or a combined approach
Qualitative focus: When you want to identify behavior, motivations, pain points, opinions and the reasons behind actions.
– Smaller sample size
– Broad open-ended questions
– Focus on user narratives, quotes, reasoning
– Finding example: You observe that users struggle to find the donation page and express confusion during the process. This insight is captured through direct observation and user feedback.
Quantitative focus: When you want to measure and evaluate user performance.
– Larger sample size
– Specific standardized tasks
– Focus on structure and numeric measurable outcomes
– Finding Example: You measure that only 60% of users are able to complete the donation process within five minutes, and the average time to find the donation page button is 2 minutes.
When might you conduct usability tests?
Discovery phase, mid-development phase, pre-launch stage, and post-launch stage.
How many participants are needed?
In qualitative research, the sample size is often determined by the point at which saturation is reached. Typical ‘rule of thumb’ is 3-8 participants, but it really depends on your resources, objectives, and project complexity. In quantitative research, the sample size is typically 20+ in order to get statistically significant results. See more information here.
How long does it take?
This is dependent on several factors, but it’s estimated to take between 35-65 hours spread across week(s). (Please note: this is an estimate. This approximation is thought to be part-time considering that some tasks may also require waiting periods, i.e. recruiting participants).
– Planning, Developing Test Materials, and Recruiting: 15-25 hours
– Conducting the Tests: 10-20 hours
– Analyzing Data: 10-20 hours
Grand Total Estimate
— Minimum: 35 hours
— Maximum: 60 hours
Useful tools:
– Maze (live web testing)
– Hotjar (heatmaps and screen recordings)
Resources:
– Planning Resources (Potentially a planning document, project management tools)
– Prototype, Design Mockup, and/or live website for testing
– Task scenarios
– Usability test software (see a few recommendations in the tools section above)
– Virtual meeting platform (unless doing in-person)
– Analysis tools (depends what/how you choose to analyze)
Links:
Read about how we tested the new information architecture and navigation through usability tests through this Medium article.
Steps:
1. Define Your Objectives: First, clarify what you want to learn. What specific aspects of your website are you testing? What problems are you trying to solve?
2. Recruit Participants: Find people who represent your target users. Aim for a diverse group to get a range of perspectives. You can recruit in various ways, including through your website (see here), through email lists, and more.
3. Prepare Test Materials: Create a scenario or tasks for participants to complete. These should be realistic and reflect typical user interactions with your product. Prepare any necessary prototypes, wireframes, or materials for the test.
4. Set Up the Test Environment: If moderating the test, choose a quiet, comfortable space for the test. Make sure you have all the necessary equipment set up. Ensure that any screen recording or observation tools are working properly. If providing participants with a link to conduct the test themselves, make sure the link is working and the test is ready for them to complete.
5. Conduct the Test: If moderating the test, start by explaining the purpose of the test and reassuring participants that you’re testing the product, not them. Then, guide them through the tasks one by one. Encourage them to think out loud and express their thoughts and feelings as they interact with the product. If doing an unmoderated test, participants can conduct the test on their own time.
6. Take Notes and Observe: If moderating the test, as participants complete the tasks, take detailed notes on their actions, comments, and any issues they encounter. Pay attention to patterns and common problems that arise.
7. Debrief and Gather Feedback: If moderating the test, after each session, ask participants about their overall impressions and any specific likes or dislikes they have. Give them the opportunity to provide additional feedback or suggestions for improvement.
8. Analyze Results: Review your notes and observations to identify key insights and trends. Look for common usability issues or areas where the product could be improved.
9. Iterate and Improve: Use the findings from the usability test to make changes to your product or service. Prioritize fixes based on the severity of the issues and the impact on the user experience.
10. Repeat as Needed: Usability testing is an iterative process, so don’t be afraid to conduct multiple rounds of testing as you refine your product. Each round will help you uncover new insights and continue to improve the user experience.
Example:
Read more about how we tested the new information architecture and navigation to learn about how we conducted usability tests, why, and what we learned.
What we did
The Planet 4 team spent two years researching and redesigning the information architecture and navigation for Greenpeace websites to address key user issues. After redesigning the site to address these issues, we wanted to understand if the changes were working and conducting a usability test made the most sense for us.
Why we used this test
We identified major pain points: low usage of the navigation bar, confusion about website structure, and difficulty finding content. After developing and refining new designs, we created high-fidelity prototypes to test with real users. A usability test was chosen to validate our design decisions to understand if these design choices align with users expectations, preferences, and behavior.
How we tested
We conducted moderated usability tests with 13 participants from diverse backgrounds on desktop and mobile devices, examining how they navigated the site and found content. To facilitate these tests, we created two different scenarios: one group started from the homepage, while the other group entered through a petition page.
Findings
Overall, users found the new design clean, clear, and intuitive, with effective navigation using menus, in-page links, and the search bar. However, we identified areas for improvement, such as enhancing navigation cues. These insights validated our design approach and highlighted areas for further refinement.

Card Sorting
Card sorting involves asking participants to organize content or features of the website into categories that make sense to them. This method helps in understanding users’ mental models and how they expect information to be structured on the website.
QUALITATIVE TEST
💖
🧍🏻
15 users
⏰
20-40 hours
QUANTITATIVE TEST
🧠
🧍🏻
30-50 users
⏰
20-40 hours
There are different types of card sorting, read on to learn more:
Open card sorting:
In open card sorting, participants are given a set of unlabeled cards representing content items or topics and are asked to organize them into groups based on their own logic. Participants are also typically asked to label each group they create. Open card sorting allows researchers to understand how users naturally categorize and group content without any predefined categories or constraints. This method is particularly useful in the early stages of design when exploring different ways of organizing information and understanding users’ mental models.
Closed card sorting:
In closed card sorting, participants are provided with a predefined set of categories or groups, and they are asked to sort the cards into these existing categories. Closed card sorting is useful for validating existing information architectures or navigation structures, as well as for evaluating the effectiveness of predefined categories. This method can help designers assess whether the proposed categories align with users’ mental models and expectations and identify any inconsistencies or gaps in the navigation structure.
Qualitative or Quantitative?
Quantitative process but the output and aims can be both qualitative or quantitative.
Qualitative focus: When you want to understand the reasons behind participants choices.
Quantitative focus: When you want to understand the relationships between categories or groups.
When might you conduct card sorting?
Discovery phase, concept testing, design and development phase, pre-launch stage, and post-launch stage.
How many participants are needed?
Recommended to have at least 15 participants for a qualitative card sort and 30-50 participants for a quantitative card sort. See more information here.
How long does it take?
This is dependent on several factors, but it’s estimated to take between 22-40 hours spread across week(s). (Please note: this is an estimate. This approximation is thought to be part-time considering that some tasks may also require waiting periods, i.e. recruiting participants).
– Planning and Recruiting: 10-20 hours
– Distributing the tests: 2-5 hours
– Analyzing Data: 10-15 hours
Grand Total Estimate
— Minimum: 20 hours
— Maximum: 40 hours
Useful tools:
– Maze (card sorting feature)
– Miro (create your own card sorting, templates available)
– Optimal Sort (card sorting platform)
Resources:
– Planning Resources (Potentially a planning document, project management tools)
– Card sorting software (see a few recommendations in the tools section above)
– Virtual meeting platform (unless doing in-person)
– Analysis tools (depends what/how you choose to analyze)
Links:
Learn about the card sorting results that informed the new IA & Nav here.
Steps:
1. Define Objectives: Start by clearly defining the objectives of the card sorting activity. Determine what you want to achieve, whether it’s organizing content, understanding user mental models, or improving navigation.
2. Select Content: Gather the items (topics, concepts, tasks, etc.) that you want participants to sort. These can be written on physical cards or presented digitally, depending on whether it’s in person or remote.
3. Recruit Participants: Find people who represent your target users. Aim for a diverse group to get a range of perspectives. You can recruit in various ways, including through your website (see more info here), through email lists, and more.
4. Explain Instructions: Provide clear instructions to participants, explaining the purpose of the activity and how it will be conducted. Ensure they understand the task and any constraints (e.g., time limits).
5. Conduct the Sorting: Let participants organize the items into groups that make sense to them. For a closed card sort, you may provide predefined categories. For an open card sort, participants create their own categories.
6. Collect Data: Record the sorting results. In an in-person setting, this may involve taking notes or photos. In a remote setting, participants can input their sorting electronically or verbally report their groups.
7. Analyze Results: Once all participants have completed the sorting, analyze the data. Look for patterns, commonalities, and differences in how participants grouped the items.
8. Iterate (if necessary): Depending on the findings, you may need to iterate on the organization of your content. This could involve adjusting categories, revising labels, or reconsidering the structure based on user feedback.
9. Implement Changes: Apply the insights gained from the card sorting activity to your content organization. Update your website navigation, information architecture, or content structure accordingly.
10. Evaluate and Test: Finally, evaluate the effectiveness of the changes you’ve implemented. Test the new organization with users to ensure it meets their needs and improves their experience.
Example:
The Planet 4 team used card sorting to help guide the new IA & Nav project.
What we did
The Planet 4 team conducted a card sorting exercise using Miro with internal and external members to understand how people would group cards and name clusters which would inform how to define the new Information Architecture.
This was conducted with 12 groups (of 4-6 people) of Greenpeace staff, including P4 stakeholders, communication hub, and the P4 team as well as 28 external participants who responded to a survey as well as GPI twitter followers.
Why we used this test
Card sorting was chosen as the method for understanding users mental models and helped to inform the new organization and categorization of information.
How we tested
Tests were conducted on Miro and users were asked to read the cards and drag them to the clusters or categories to group them and name the categories. Examples of cards that users had to group included ‘Join a local group,’ ‘Be part of the reuse revolution,’ ‘Save the Amazon and support the protectors of the rainforest,’ and much more.
Findings
The most popular groups were ‘Get to know us,’ ‘What you can do,’ and ‘New & Stories.’ Learn more here.
Surveys
Surveys involve gathering feedback from a larger sample of website users, in which you can cover a wide range of topics, including user satisfaction, perceived usefulness, ease of use, and demographic information. There are qualitative and quantitative surveys.
QUALITATIVE TEST
💖
🧍🏾♀️
5 users
⏰
22-60 hours
QUANTITATIVE TEST
🧠
🧍🏾♀️
40 users
⏰
22-60 hours
Qualitative or Quantitative?
Qualitative, quantitative or a combined approach
Qualitative focus: when you want to understand experiences, opinions, discover problems or opportunities.
– Explore detailed insights and motivations.
– Open-ended questions.
– Small sample size.
– Subjective analysis.
– Useful for understanding context and informing design.
Quantitative focus: when you want to use measurements to confirm problems or opportunities and draw statistically significant conclusions.
– Collect numerical data.
– Structured questions.
– Large sample size.
– Objective analysis.
– Useful for measuring trends, behaviors, and making generalizable conclusions.
When might you conduct qualitative surveys?
Discovery phase, concept testing, design and development phase, pre-launch stage, and post-launch stage.
When might you conduct quantitative surveys?
– Usability testing and evaluation (they can be used as part of the test, i.e. asking users to rate their satisfaction with specific features or tasks)
– Beta testing and pilot studies
– Post-launch evaluation stage
– Part of ongoing improvement and iteration
How many participants are needed?
For qualitative surveys, 5 participants are recommended (see more here) and for quantitative surveys, 40 participants are recommended (see more here).
How long does it take?
This is dependent on several factors, but it’s estimated to take between 22-60 hours spread across week(s). (Please note: this is an estimate. This approximation is thought to be part-time considering that some tasks may also require waiting periods, i.e. recruiting participants).
– Planning and Recruiting: 10-20 hours
– Distributing the survey: 2-5 hours
– Analyzing Data: 10-15 hours
Grand Total Estimate
— Minimum: 22 hours
— Maximum: 40 hours
Useful tools:
– Hotjar (On-site surveys)
– Optimonk (Popups with ability to link to surveys)
– SurveyMonkey
– Google Forms
Resources:
– Planning Resources (Potentially a planning document, project management tools)
– Survey design guide (to outline objectives, target audience, question types, etc.)
– Survey platform (see a few recommendations in the tools section above)
– Analysis tools (depends what/how you choose to analyze)
Links:
Learn more about Global Surveys and how to understand who our audience is and the main pain points identified.
Steps:
1. Define Objectives: Clearly outline the purpose and objectives of the survey. Determine what information you want to gather and how you’ll use it to make decisions or gain insights.
2. Identify Audience: Define your target audience or participants for the survey. Consider demographics, behaviors, or other characteristics relevant to your objectives.
3. Choose Survey Type: Decide whether your survey will be qualitative or quantitative. Qualitative surveys are more for gathering insights and opinions, while quantitative surveys are more for collecting measurable data with fixed response options.
4. Select Survey Tool: Choose a survey tool or platform to create and distribute your survey. There are many options available, ranging from free to paid, with various features and customization options.
5. Design Questions: Create clear and concise survey questions that align with your objectives. Use simple language, avoid leading or biased questions, and provide response options that cover all possible answers.
6. Pretest the Survey: Before launching the survey to your target audience, pretest it with a small group of people to identify any issues with question wording, response options, or survey flow. Make necessary revisions based on feedback.
7. Launch the Survey: Once you’re confident in the survey’s design, distribute it to your target audience. This could involve sending email invitations, sharing a survey link on social media, or embedding the survey on your website.
8. Monitor Responses: Keep track of survey responses as they come in. Most survey tools provide real-time analytics and reporting features that allow you to monitor response rates and view preliminary results.
9. Analyze Data: Once data collection is complete, analyze the survey responses. For qualitative surveys, identify themes and patterns in the open-ended responses. For quantitative surveys, calculate descriptive statistics and look for trends or correlations in the data.
10. Draw Conclusions and Take Action: Based on your analysis, draw conclusions from the survey findings. Consider how the results align with your objectives and what actions or decisions they suggest. Use the insights gained to inform future strategies or initiatives.
Example:
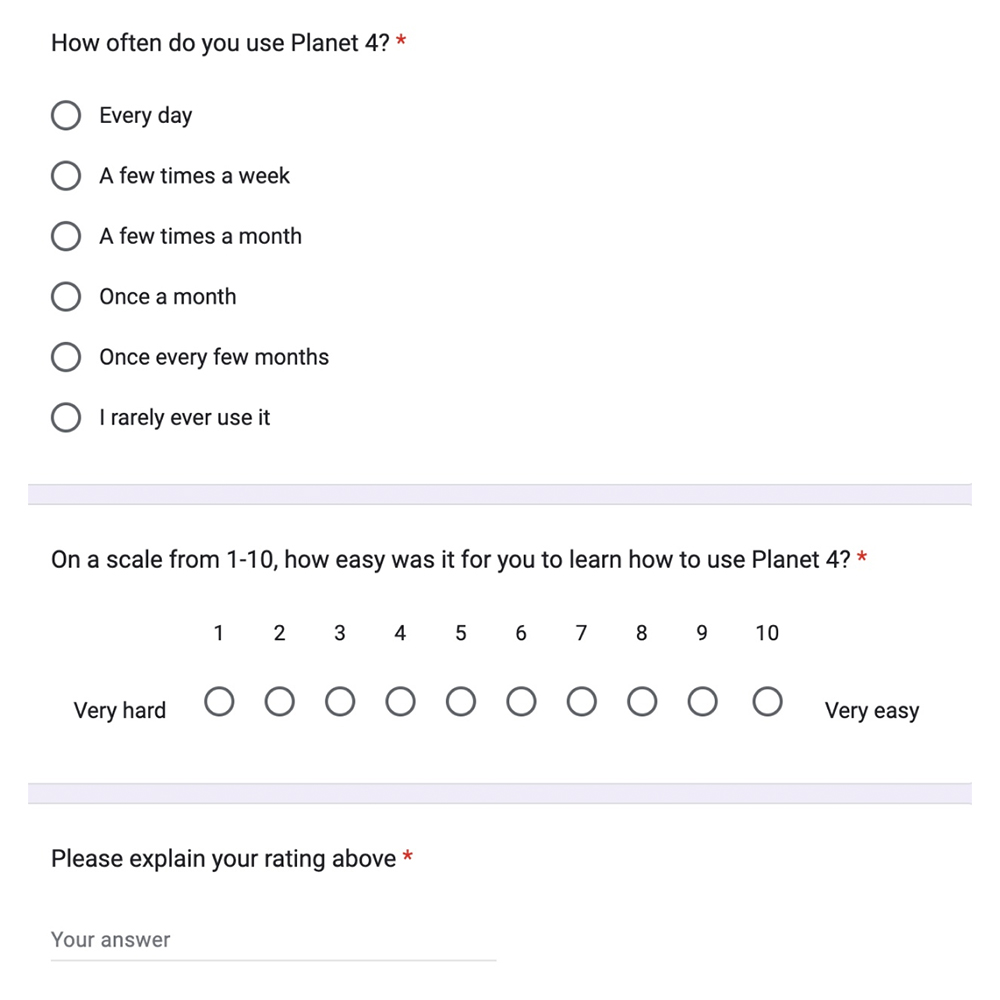
The Planet 4 team has worked on a variety of surveys, including an Ease of Use survey, as part of the IA & Nav project, that was launched across all P4 NROs to better understand frontend users.
What we did
A survey was launched across all P4 NROs using Hotjar to better understand why users are visiting our websites, how easy or difficult they found the navigation and experience and to learn more about any potential issues or challenges.
Why we used this test
A survey provides direct feedback from real users so that we can better understand their needs, challenges, and preferences. The results of the survey helped to inform our pain points for the IA&Nav project.
How we tested
Surveys were added to every NRO and translated to various languages. When the survey was ready, it was launched across all websites.
Findings
The results of this survey showed that we needed clearer opportunities for users to take specific action. Additionally, it showed that we needed more navigation elements in the primary navigation bar. These, and other pain points identified, could be addressed by the Planet 4 team as a result of the survey.

A/B Testing
A/B testing, also known as split testing, involves comparing two versions of a webpage (A & B) to determine which one performs better in terms of a predefined metric, (click-through rates, conversion rates, or time on page). Randomly presenting different versions to users allows you to measure the impact of design changes or feature implementations objectively.
QUANTITATIVE TEST
🧠
🖥️
500 sessions
⏰
15-20 hours
Qualitative or Quantitative?
Quantitative
When might you conduct A/B Testing?
Prototype evaluation, beta testing, post-launch optimization, product iteration and improvement
How many participants are needed?
The sample size depends on the experiment you are running, your typical users, and the desired confidence interval. You can use a sample size calculator. For web experiments, aim for at least 500 participants.
How long does it take?
This is dependent on several factors, but it’s estimated to take between 15-40 hours spread across week(s). (Please note: this is an estimate. This approximation is thought to be part-time considering that some tasks may also require waiting periods, i.e. recruiting participants).
– Planning and designing variations: 5-20 hours
– Running the A/B test (which includes monitoring, adjusting, managing): 5-10 hours
– Analyzing Data: 5-10 hours
Grand Total Estimate
— Minimum: 15 hours
— Maximum: 40 hours
Useful tools:
– Convert
– VWO
– Insider
– A/B Tasty
– Optimonk AI
– Optimizely
Resources:
– Planning Resources (Potentially a planning document, project management tools)
– A/B testing plan (to outline objectives, hypothesis, variations to test, success metrics, etc.)
– Participant segmentation tools (i.e. Google Analytics, Mixpanel, etc.)
– A/B test software (see a few recommendations in the tools section above)
– Analysis tools (depends what/how you choose to analyze)
Links:
Learn more about the Cookies A/B test here.
Steps:
1. Define Goals: Clearly define the objective of your A/B test. Whether it’s increasing conversions, improving click-through rates, or enhancing user engagement, ensure your goal is specific and measurable.
2. Identify Elements to Test: Determine which elements of your product or website you want to test. This could include headlines, call-to-action buttons, layouts, images, or any other variable that may impact the user experience.
3. Create Variations: Develop multiple versions (A and B) of the element you’re testing. Ensure that each variation differs in only one aspect, so you can accurately determine which change influenced the outcome.
4. Randomize and Split Traffic: Use A/B testing tools to randomly split your audience into groups, with each group exposed to a different variation. Randomization helps minimize bias and ensures a fair comparison between the variations.
5. Set Sample Size and Duration: Determine the sample size needed for statistical significance and the duration of the test. A larger sample size typically provides more reliable results, but ensure the test runs long enough to capture a representative sample of user behavior.
6. Run the Test: Launch the A/B test and monitor the performance of each variation in real-time. Track relevant metrics such as conversion rates, click-through rates, or engagement metrics to assess the impact of the changes.
7. Statistical Analysis: Once the test is complete, analyze the data to determine if there’s a statistically significant difference between the variations. Use statistical methods such as hypothesis testing or confidence intervals to assess the significance of the results.
8. Draw Conclusions: Based on the analysis, draw conclusions about which variation performed better in achieving your objectives. Consider factors such as statistical significance, practical significance, and any unexpected outcomes.
9. Implement Winner: If one variation outperformed the other significantly, implement the winning variation as the new default. If the results are inconclusive or the differences are minimal, consider further iterations or additional testing.
10. Document Learnings: Document the results of the A/B test, including insights gained, lessons learned, and any recommendations for future experiments. Share these findings with relevant stakeholders to inform decision-making and improve future testing efforts.
Example:
The Planet 4 team conducted an A/B test to understand how changes to the Cookies Block would affect the user experience.
What we did
The Planet 4 Team suspected that privacy was not properly being respected because of the previous consent mechanism on the platform. So, the team created a new iteration of the “cookies bar” with more opportunities for users to customize and update their consent cookie collection. The team used an A/B test to estimate the impact the new cookies bar would have on the amount of users accepting cookies.
Why we used this test
The team chose to do an A/B test because we wanted to compare two versions of the same site element. An A/B test ensured that the experiment was completely randomized, so we know for sure that any changes were attributed to the change in the cookies bar itself.
How we tested
We conducted the A/B test using Google Optimize (a tool that is now retired, similar optimization tools include Convert, Optimizely, A/B Tasty, etc). This allowed us to split website traffic into two versions of the website, one with the old cookies bar, and one with the new one. This allowed us to calculate the impact the cookies bar had on conversion rates to a specified confidence interval.
Findings
It was determined that the new version was more successful on Desktop, but less successful on Mobile. The team was able to use this information to make further changes to the new iteration of the Cookies Bar to better suit mobile. The full experiment can be viewed here.
Heatmaps
Heatmap tools visualize user interaction data by displaying areas of a webpage that receive the most and least engagement. Heatmaps can show where users click, move their mouse cursor, or spend the most time, helping you identify areas of interest, user preferences, and potential usability issues.
QUANTITATIVE TEST
🧠
🖥️
500 sessions
⏰
3-5 hours
Qualitative or Quantitative?
Quantitative
When might you analyze Heatmaps?
Discovery phase, concept testing, and post-launch stage. Heatmaps can also be analysed on an ongoing basis to gather insight on how users navigate your website.
How many participants are needed?
500 sessions per page.
How long does it take?
– This depends on how many visitors your webpage averages, it could be completed in as early as 1 day.
– This is dependent on several factors, but it’s estimated to take between 3-5 hours spread across week(s). (Please note: this is an estimate. This approximation is thought to be part-time considering that some tasks may also require waiting periods, i.e. recruiting participants).
– Planning: <1 hours
– Creating the Heatmaps: <1 hours
– Analyzing Data: 1-3 hours
Grand Total Estimate
— Minimum: 3 hours
— Maximum: 5 hours
Useful tools:
– Hotjar
– Fullsession
– Smartlook
Resources:
– Planning Resources (Potentially a planning document, project management tools)
– Heatmap test software (see a few recommendations in the tools section above)
– Analysis tools (depends what/how you choose to analyze)
Steps:
1. Select a Heatmap Tool: Choose a heatmap tool or platform that suits your needs.
2. Define Objectives: Clearly define the objectives of your heatmap analysis. Determine what specific insights you hope to gain from the data, such as understanding user behavior, identifying areas for improvement, or optimizing conversion paths.
3. Set Up Tracking: Install the heatmap tracking code on your website to start collecting data. Follow the instructions provided by your chosen heatmap tool to integrate the tracking code into your website’s pages.
4. Select Pages to Analyze: Choose which pages of your website you want to analyze with heatmaps. Focus on key pages such as the homepage, landing pages, etc. depending on your objectives.
5. Generate Heatmaps: Use the heatmap tool to generate heatmaps for the selected pages. Heatmaps visualize user interaction data, such as clicks, scrolls, mouse movement, or attention, providing insights into how users engage with your website.
6. Review Heatmap Data: Analyze the heatmap data to identify patterns, trends, and areas of interest. Pay attention to hotspots (areas with high activity) and cold spots (areas with low activity) to understand user behavior and preferences.
7. Interpret Findings: Interpret the findings from the heatmaps in the context of your objectives. Look for opportunities to improve user experience, optimize page layout and design, or enhance conversion paths based on the insights gained.
8. Identify Pain Points: Identify any pain points or usability issues revealed by the heatmaps, such as areas where users frequently click without success, encounter friction in navigation, or disengage from the page.
9. Generate Insights: Generate actionable insights from the heatmap analysis to inform website optimization strategies. Prioritize recommendations based on the severity of issues, potential impact on user experience, and alignment with business goals.
10. Implement Changes: Implement changes or optimizations to address the insights gained from the heatmap analysis. This could involve redesigning page layouts, adjusting content placement, optimizing call-to-action buttons, or streamlining the user journey.
Example:
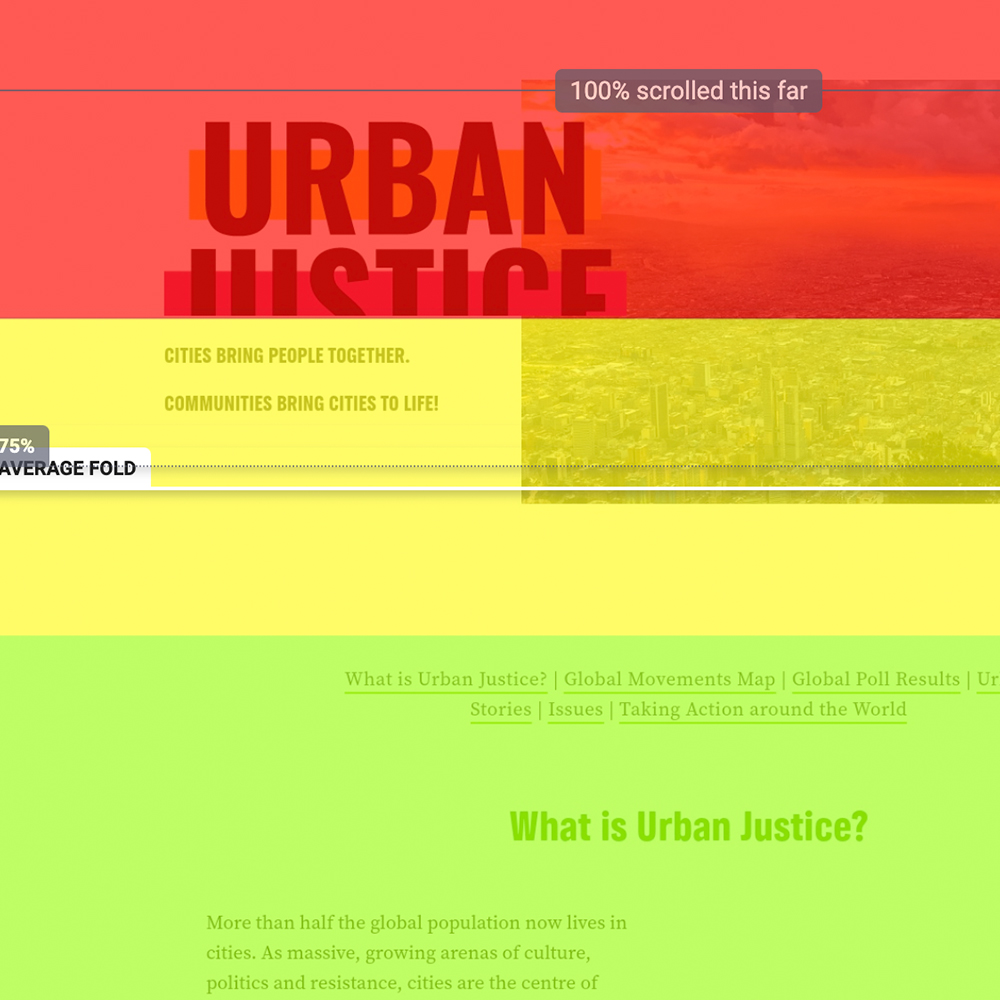
The Planet 4 team created a Heatmap for the Greenpeace Brazil Homepage to understand how users interact with the different navigation elements.
What we did
When researching how users navigate Planet 4 websites, the P4 team wanted to understand how important different navigation elements on the Home Page were. We wondered if users primarily navigated through the Navigation Bar or if they preferred other elements on the page. So, we used Hotjar to generate a Heat Map of the Greenpeace Brazil Homepage.
Why we used this test
We chose to create a heatmap because it is a quick and easy way to get qualitative data on what elements the users are clicking on. It immediately brings to attention what is (or is not) being noticed by users.
How we tested
We used Hotjar to generate the heatmap. To do this, we chose which webpage (url) we wanted to evaluate, and the date range we were interested in. Hotjar then generates a Heatmap showing clicks, or other events you choose.
Findings
The Heatmap showed rather than the navigation menu, users favored guiding arrows on the carousel header and the search bar. With this information, the P4 team knows to continue to refine the Navigation Menu options and compliment it with additional logical navigation throughout the page.

Web Analytics
Website analytics tools provide a wealth of quantitative data about user behavior, traffic sources, conversion rates, and engagement metrics. Key metrics include page views, bounce rates, average session duration, conversion rates, and goal completions. By analyzing website analytics data, you can understand how users interact with your website, identify popular content, and track performance over time.
QUANTITATIVE TEST
🧠
🖥️
100 sessions
⏰
15 minutes
Qualitative or Quantitative?
Quantitative
When might you look into your website analytics?
Discovery phase, pre-launch stage, and post-launch stage. Website Analytics should be reviewed on an ongoing basis.
How many participants are needed?
Minimum of 100 sessions.
How long does it take?
This depends on the information you are trying to uncover. You can view an overview of your Web Analytics data in less than 15 minutes, or do a detailed analysis over several months.
Useful tools:
– Google Analytics
– Mixpanel
Resources:
– Planning Resources (Potentially a planning document, project management tools)
– Website analytics plan (to outline objectives, define KPIs, goals for tracking website performance, etc.)
– Participant segmentation tools (i.e. Google Analytics, Mixpanel, etc.)
– Website analytics software (see a few recommendations in the tools section above)
Links:
Read more about Planet 4’s audience research gathered through Website Analytics
Steps:
1. Define Goals and Objectives: Start by defining the goals and objectives of your website analytics efforts. Determine what specific insights you’re looking to uncover, whether it’s understanding user behavior, tracking conversions, improving engagement, increasing traffic, etc.
2. Select Analytics Tools: Choose the appropriate analytics tools for your needs.
– Set Up Tracking: If your chosen tool is not already set up, the tracking code provided by your chosen analytics tool bust be installed into the header of your website. This code will collect data about user interactions, traffic sources, conversions, and other relevant metrics.
3. Collect Data: Once tracking is set up, start collecting data about your website’s performance. Monitor metrics regularly to track changes over time and identify trends or patterns.
4. Segment Data: Segment your analytics data to gain deeper insights into different audience segments, traffic sources, devices, geographic locations, or other relevant dimensions. This allows you to understand how different groups of users interact with your website.
5. Analyze Traffic Sources: Analyze the sources of traffic to your website, including organic search, direct traffic, referral traffic, social media, etc. Identify which channels drive the most traffic, which ones have the highest conversion rates, and where opportunities for growth exist.
6. Evaluate User Behavior: Analyze user behavior on your website, including navigation paths, page views, time on page, exit pages, and interactions with specific elements (e.g., forms, buttons, videos). Understand how users move through your site and where they encounter friction or obstacles.
7. Monitor Conversions: Track conversion events and goals on your website, such as form submissions, newsletter sign-ups, or other desired actions. Analyze conversion funnels to identify drop-off points and optimize the user journey for better conversion rates.
8. Draw Insights and Take Action: Based on your analysis of website analytics data, draw actionable insights and recommendations. Identify areas for improvement, optimization opportunities, and strategies for achieving your goals. Implement changes to your website and marketing efforts based on these insights, and continue to monitor and iterate over time.
Example:
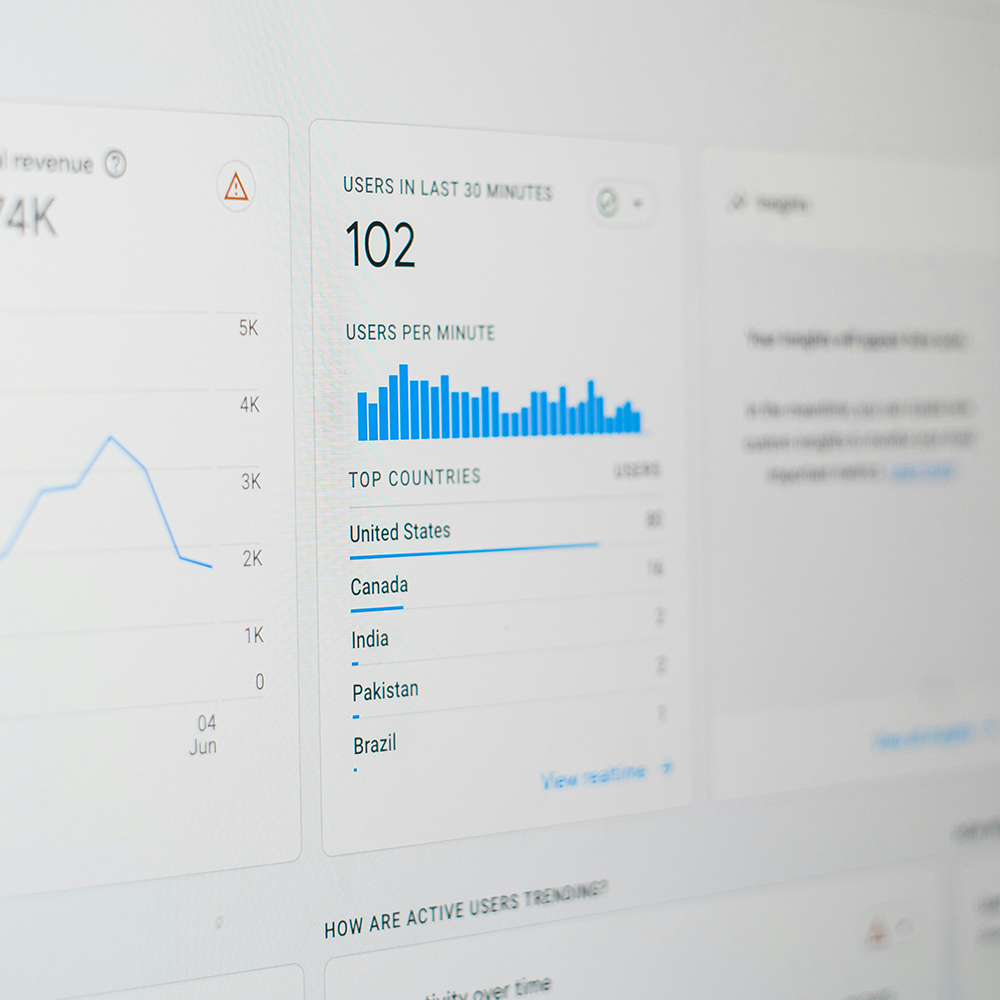
We will share an example of how you can use Google Analytics to track your website.
What we did
In this hypothetical example, Greenpeace International used Google Analytics 4 to understand which pages on their site were viewed the most.
Why we used this test
Web Analytics tools like GA4 allow you to quickly assess a specific metric. Because we wanted a specific metric (page views), we could easily find the answer we were looking for without any complicated tests.
How we tested
In this scenario, GPI opened GA4 and navigated to Life Cycle -> Engagement -> Pages and Screens. They would see a summary of views, users, and other statistics for each page with the option to add additional filters like Page Type or User Segment. They filteded by Page Type, and could use the information to make decisions about which pages to display important information on (for example, a donate button)
Findings
Greenpeace International found that the most viewed page was their homepage, with
34,099 visitors in the time frame specified.

Tree Testing
Tree testing involves creating a hierarchical structure of a website, designing tasks for participants to navigate through it, and analyzing their interactions to optimize the website’s navigation and information architecture. This method helps identify navigation issues and assess the organization of content.
QUALITATIVE TEST
💖
🧍🏾
3-8 users
⏰
22-40 hours
QUANTITATIVE TEST
🧠
🧍🏾
50+ users
⏰
20-40 hours
Qualitative or Quantitative?
Qualitative, quantitative or a combined approach
Qualitative focus: when you want to understand why behind their decisions and their thought processes, behavior, and thoughts
– Used for rapid testing and iteration of information architecture ideas
– Requires only a few participants
– Often conducted as a moderated study
– Not suitable for gathering statistical data like success rates or task completion times
Quantitative focus: when want to find find broader patterns on a larger scale
– Used to benchmark navigation structures and compare against competitors or alternative designs
– Requires a larger sample size
– Provides data on user success rates and time to find resources
– Useful for comparing multiple navigation structure options to identify the most effective one
When might you conduct qualitative tree testing?
Discovery phase, prototype testing, pre-launch stage, and post-launch stage
When might you conduct quantitative tree testing?
Design and development, pre-launch stage, and post-launch stage
How many participants are needed?
In qualitative research, the sample size is often determined by the point at which saturation is reached. Typical ‘rule of thumb’ is 3-8 participants, but it really depends on your resources, objectives, and project complexity. In quantitative tree tests, it’s recommended to have 50+ participants. See more information here.
How long does it take?
This is dependent on several factors, but it’s estimated to take between 22-40 hours spread across week(s). (Please note: this is an estimate. This approximation is thought to be part-time considering that some tasks may also require waiting periods, i.e. recruiting participants).
– Planning, setting up the test, and recruiting: 10-20 hours
– Distributing the test: 2-5 hours
– Analyzing Data: 10-15 hours
Grand Total Estimate
— Minimum: 22 hours
— Maximum: 40 hours
Useful tools:
– Maze (tree testing feature)
– Optimal Sort
Resources:
– Planning Resources (Potentially a planning document, project management tools)
– Tree testing scenarios
– Tree testing software (see a few recommendations in the tools section above)
– Analysis tools (depends what/how you choose to analyze)
Links:
Learn more about how tree testing was done as part of the IA & Nav project here.
Steps:
1. Define Objectives: Clearly define the objectives of your tree testing exercise. Determine what specific aspects of your website’s navigation or information architecture you want to evaluate and improve.
2. Select Tree Testing Tool: Choose a tree testing tool or platform that suits your needs. Ensure the tool supports whichever type of tree testing you have chosen (qualitative and quantitative).
3. Develop Task Scenarios: Create task scenarios that reflect common user goals or actions on your website. These tasks should require participants to find specific information or complete common tasks using the website’s navigation.
4. Construct Tree Structure: Develop a hierarchical structure (tree) representing your website’s navigation or information architecture. This structure should include all main categories, subcategories, and navigation paths that users might encounter.
5. Input Tree into Tool: Input the tree structure into your chosen tree testing tool. Ensure that the navigation paths and labels accurately reflect the website’s current layout and organization.
6. Recruit Participants: Recruit participants who represent your target audience for the tree testing exercise.
7. Conduct Testing Sessions: Guide participants through the tree testing tasks, either in person or remotely depending on the chosen method. Encourage participants to think aloud as they navigate the tree structure and complete the assigned tasks.
8. Collect Data: Record participants’ interactions and responses during the tree testing sessions. Capture metrics such as task completion rates, time to completion, success paths, and navigation errors.
9. Analyze Results: Analyze the tree testing data to identify patterns, trends, and areas for improvement in the website’s navigation. Look for common issues such as navigation bottlenecks, confusing labels, or missing categories.
10. Draw Insights and Make Recommendations: Based on your analysis, draw actionable insights and recommendations for optimizing the website’s navigation and information architecture. Consider both qualitative feedback from participants and quantitative metrics to inform your recommendations.
Example:
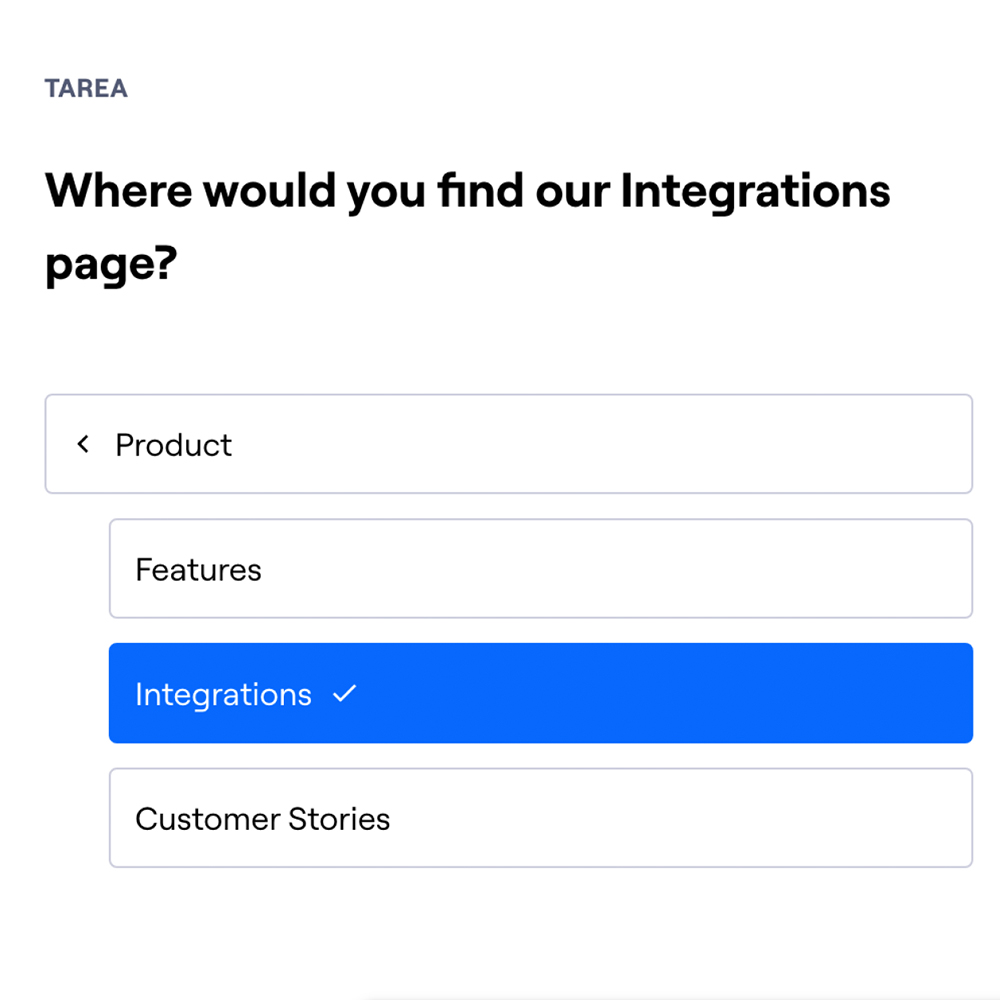
The Planet 4 team conducted unmoderated tree testing as part of the IA & Nav project.
What we did
We were seeking to identify navigation issues and validate the effectiveness of the site’s organization, structure, and labeling. These were the questions we sought to answer:
Do users understand how to navigate the site based on the categories provided?
– Are the categories and labels understandable?
– Are category names distinct enough from one another?
– Is content categorized in a user-centered manner?
– Is content difficult to find because the structure is too broad or too deep?
Why we used this test
Tree testing evaluates how well users navigate and understand information, so this was the ideal test to help inform and validate our decisions.
How we tested
The tests were split into two (Test A and Test B), with 90 participants in A and 76 participants in B.
Findings
Key insights included that overall, users were able to navigate the site based on the categories provided. Click here to learn more about how this test was done and what the team learned to help inform the new information architecture and navigation.