
Understand P4 KPIs and evaluate the P3 Google Analytics account
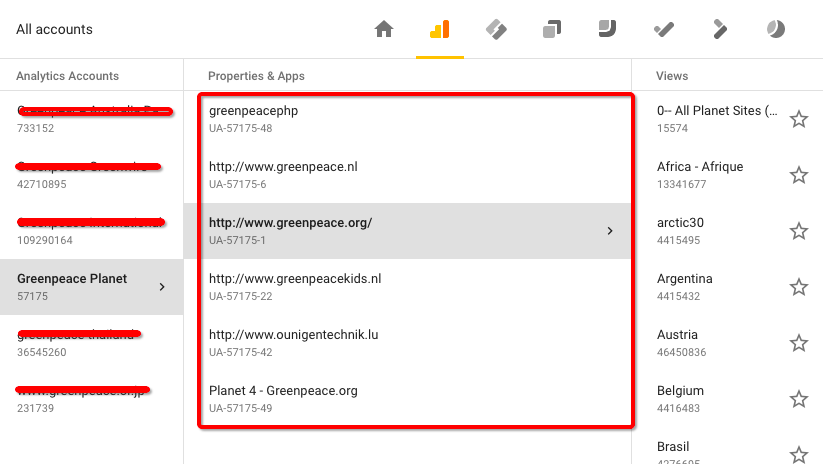
As part of the preparatory phase, each implementing office will have to assess the current status of the Google Analytics account (usually being a sub-account or view of the “Greenpeace Planet” – UA-57175-1).
Why evaluate the existing account?
The purpose of this exercise is:
- recommend the way forward to track the P4 standard KPI set– choosing between
- maintain the existing property (and ‘clean it up’!)
- create a view in the new global P4 Account (UA-10290164)
- recommend the exclusion of IP Addresses:
- NRO static IPs
- dynamic IPs – by placing a cookie in all non-office based employees’ browsers – https://www.greenpeace.org/international/?internal
- identify new goals and events to be setup
- identify new cross-domain tracking to be setup
- assess Google Analytics account permissions
- identify the Google Tag Manager container that will be connected to P4
Perform the evaluation
Starting from the evaluation done by GPI during the P4 Design, each implementing NRO must produce an assessment and upload it in the respective Planet 4 drive, indicating:
- The ACTIVE Google Analytics ID and view ID
- The ACTIVE Filters used
- The yearly total views and traffic
- The last / average 30 Days Hits
- The type of events actively tracked
- The type of goals actively tracked
- Main challenges for polluted statistics
- Any relevant custom details (triggers, channel grouping, content grouping, etc..)
And here a few completed evaluations (you can totally duplicate the template and add it to your P4 Drive!):
- Template – P3 Google Analytics (GA) account evaluation – Public
- GPI Planet 3 GA Account evaluation (UA-57175-1) – Accessible to staff only (Privacy reasons)
- GP Greece P3 GA Account evaluation (UA-36562513-1) – Accessible to staff only (Privacy reasons)
- GP New Zealand P3 GA account evaluation (UA-235924-1) – Accessible to staff only (Privacy reasons)
- GP India P3 GA account evaluation ( UA-36624786-1) – Accessible to staff only (Privacy reasons)
Which KPIs to track in P4
During the Discovery phase a set of KPIs (Key Performance Indicators) was identified, and during the Concept, the methodology to extract those wrapped up. Having a standard set of KPIs (and a common way to extract them) will allow offices to “compare apples with apples” (in some cases, P4 vs P3 performances) and finally benchmark across Greenpeace web presences.
Here’s the final list, split by “Breadth”, “Depth”and “Open” engagement areas (check the methodology to extract them):
Breadth KPIs:
- 1. Bounce Rate by Channel
- 2. Funnel Conversion by petition
- 3. Funnel Conversion Rate for volunteering
- 4. % New Users to Site
- 5. Funnel Conversion Rate start a petition
- 6. Funnel Conversion Rate for donation
- 7. Bounce Rate by page
- 8. Total sessions by channel / source
- 9. Conversion Rate for petition
- 10. Total Users / Unique Visitors
- 11. Web performance trendline (basic aggregate p/period)
Depth KPIs:
- 12. Scroll Depth
- 13. Page Depth
- 14. Visitor Frequency
- 15. Visitor Recency
- 16. Time on page by mobile device / OS
- 17. Most popular tags
- 18. Visitor Action/Conversion Frequency
- 19. Members Returning for Action (MeRA)
Open KPIs:
- 20. Number of New Blog Posts (by non-staff / Change Agents)
- 21. Social Sharing ratio
- 22. Total Comments per Day / Month
P4 Analytics Suite
Links & resources
- MEDIUM:
- “Thinking of useful web KPIs, we discovered…” (KPI & Analytics investigation)
- Comparing P3 and P4 performances (benchmark Before VS After)
- Full KPI tracking methodology for Planet 4 (KPI & Analytics consolidation methodology)
- Documentation:
- Template – P3 Google Analytics (GA) account evaluation – Public
- GPI Planet 3 GA Account evaluation (UA-57175-1) – Accessible to staff only (Privacy reasons)
- GP Greece P3 GA Account evaluation (UA-36562513-1) – Accessible to staff only (Privacy reasons)
- GP New Zealand P3 GA account evaluation (UA-235924-1) – Accessible to staff only (Privacy reasons)
- GP India P3 GA account evaluation ( UA-36624786-1) – Accessible to staff only (Privacy reasons)