
Quick summary of the incident
For full transparency the SRE and P4 team wrote this post to explain what happened during this “interesting” outage that happened three times in a row (January 14-16 / 21-22 / 28-29).
The impact was minimal for normal visitors since we cache all websites. But the maintainers had very long waiting times when doing changes.
Jan 11:
On this Thursday we deployed a new release (that bumped the PHP, dockerize and wordpress version), which like always was tested on the development and staging environment before without issues.
Jan 15:
Unfortunately on Monday we noticed that all Planet4 websites were responding slowly and needed four times more CPU resource than normal. So over the weekend something seemed to have happened (we did not connect this to the new release yet).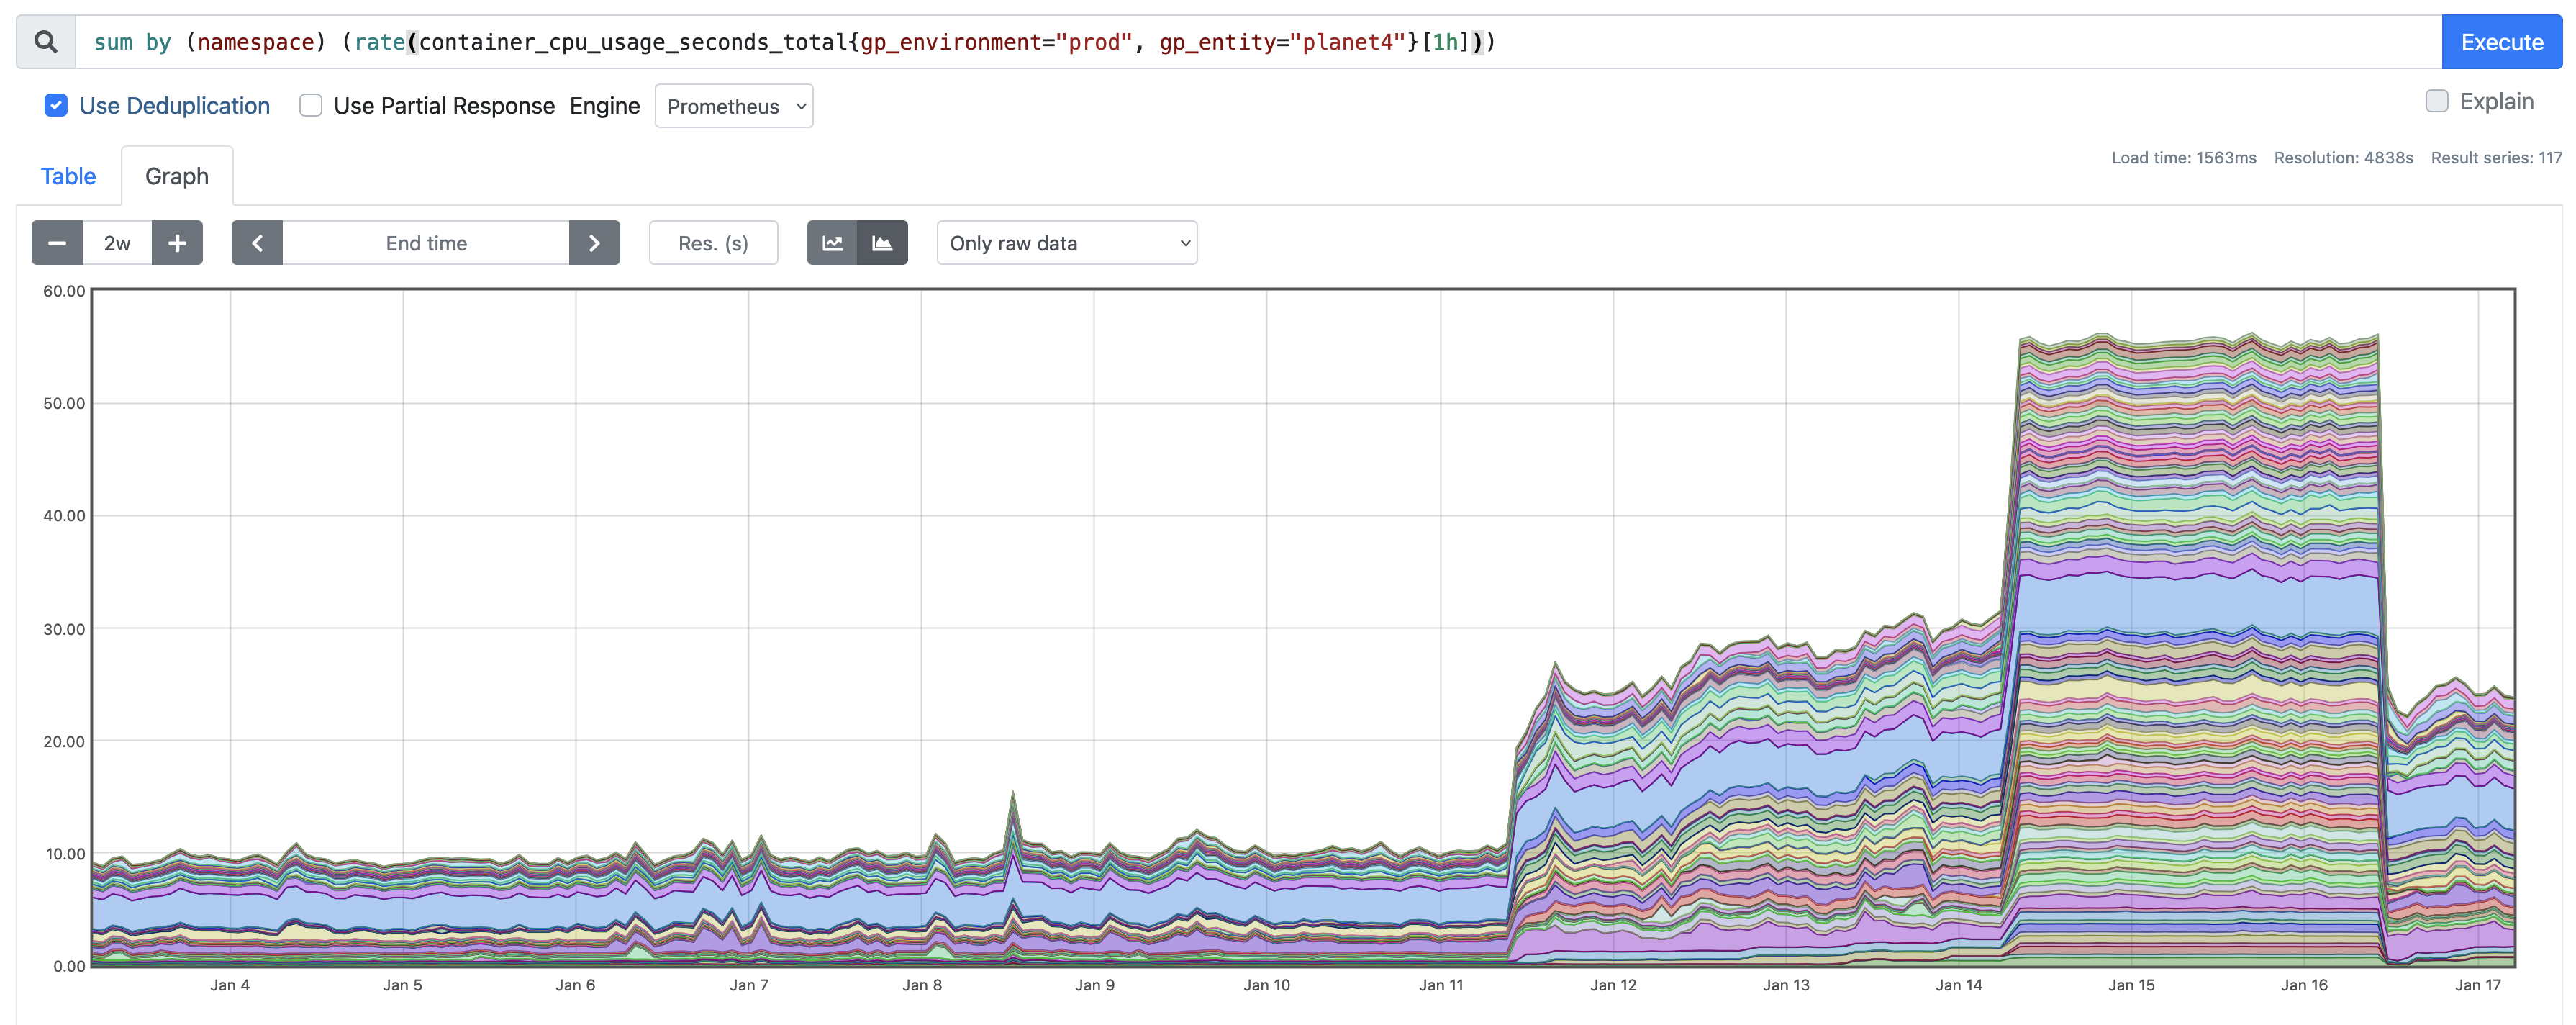
Jan 16:
While troubleshooting the workload there was another small release on Tuesday, which seemed to “solve the problem for now”.
Jan 22:
But when back from the weekend on Monday the impact was back again.
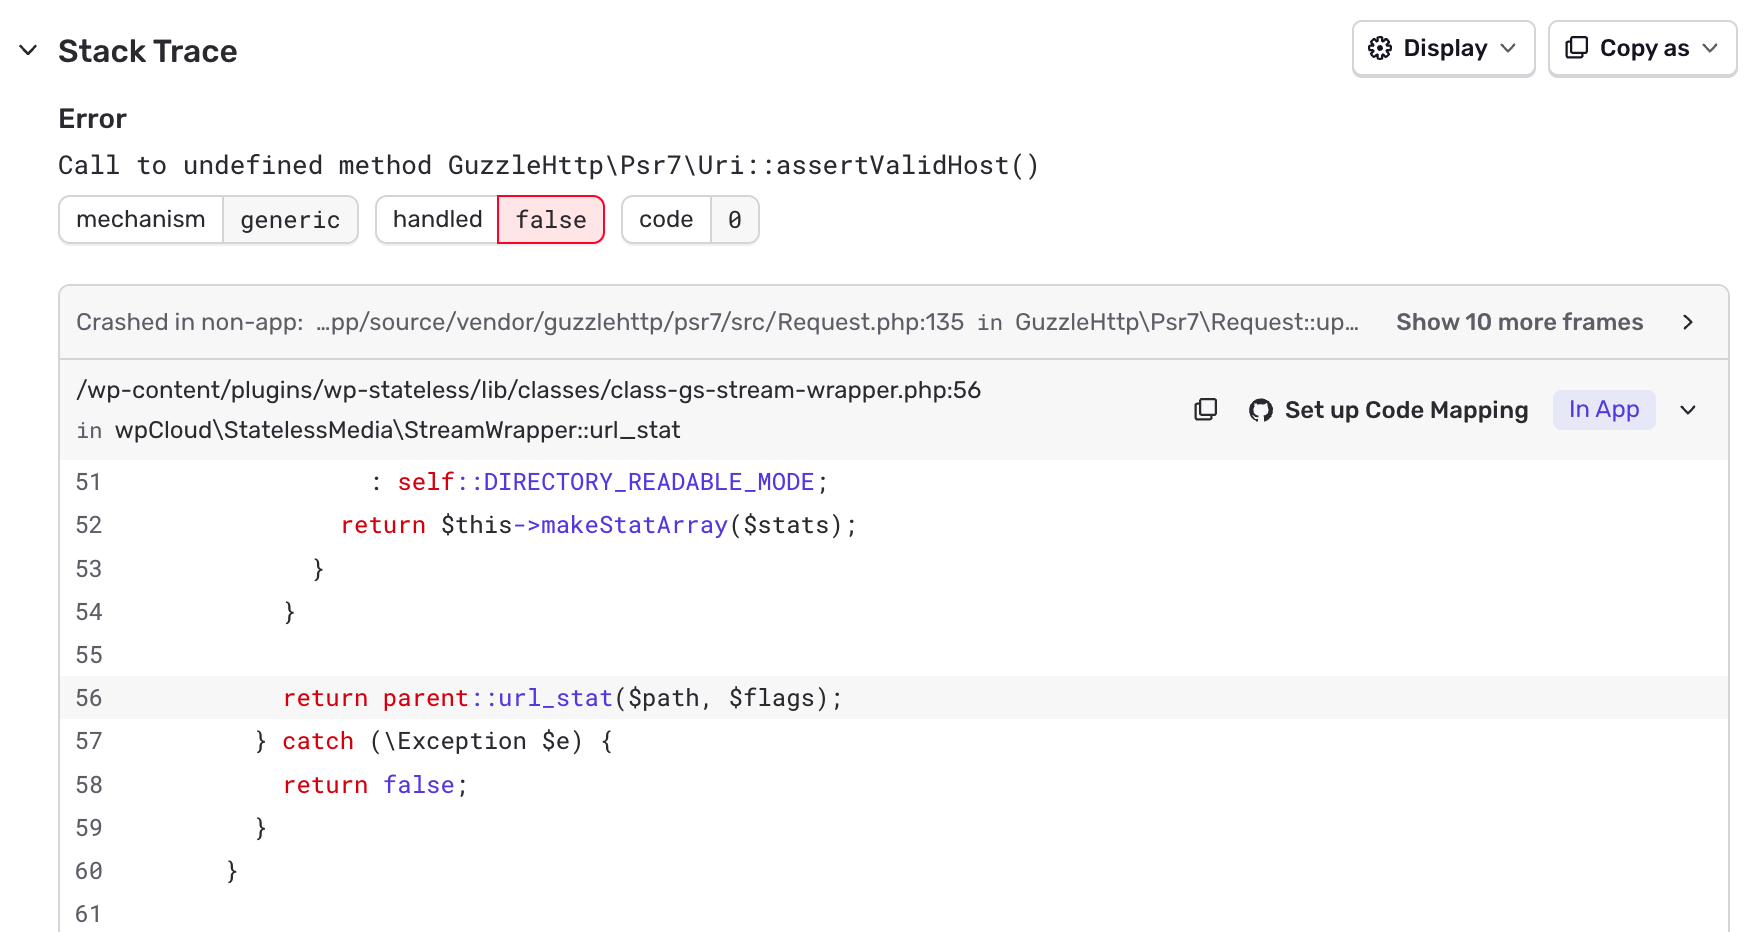
We finally found correleations between Sentry crashing (software we use to receive all errors visitors have, so we can look into them), the upgrade to PHP 8.1, and the beginning of resource exhaustion.
Jan 23:
After a nice deep-dive with some nice SRE and P4 colleagues we created a plan to test disabling the Sentry integration and PHP rollback for a few sites.
Below there is the CPU usage for Brasil before and after.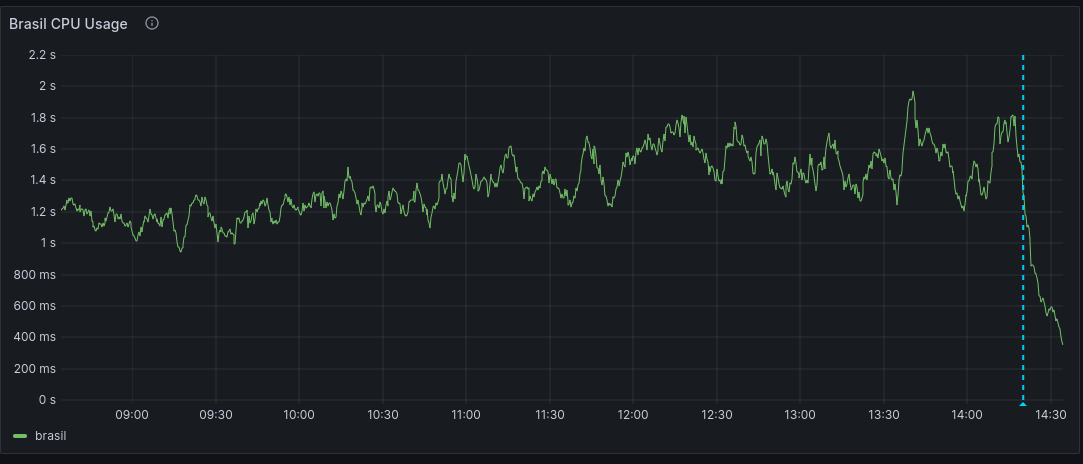
Both actions had the effect we were hoping for, so we pushed a fix to all websites that decreased the amount of messages we send to Sentry to about 25%. This eased of the excessive number of messages to Sentry, and lowered the CPU usage for the websites as well. The average latency dropped to normal behavior for all sites.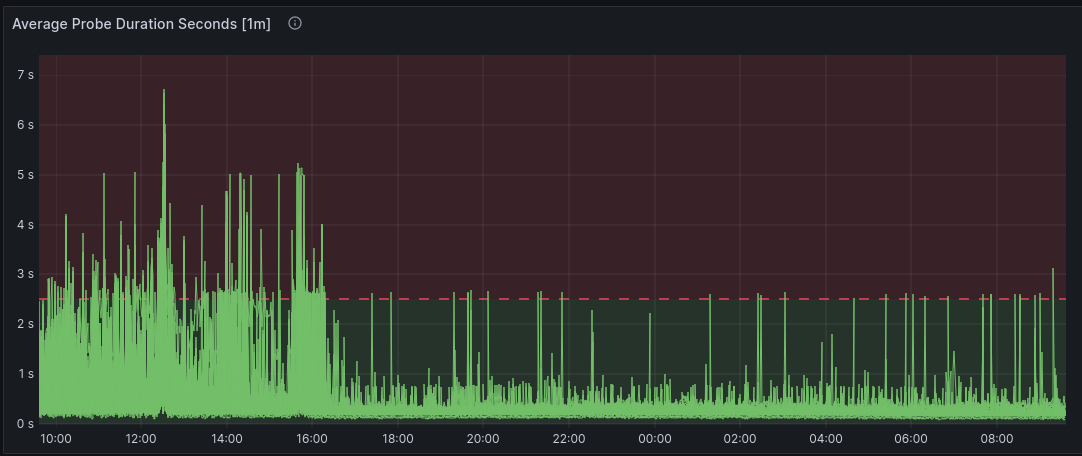
So we could start looking into the remaining issue of getting Sentry and our logging framework working again.
Jan 24:
As a last action we got Sentry and our logging/monitoring framework stable again.
Jan 29:
But when back from the weekend… again the terror of slow websites was back. The website probes we run to measure the latency were far above our normal threshold. Each dot on the visualisation is an alert we got for a slow probe (response time > 2.5 seconds). Pretty!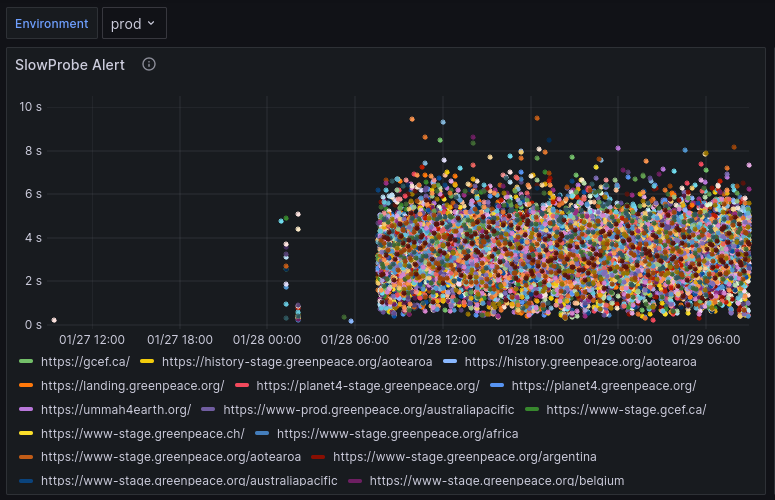
So… we redeployed all websites as a quick workaround and started another research round. As you can see, the CPU dropped after the redeployment.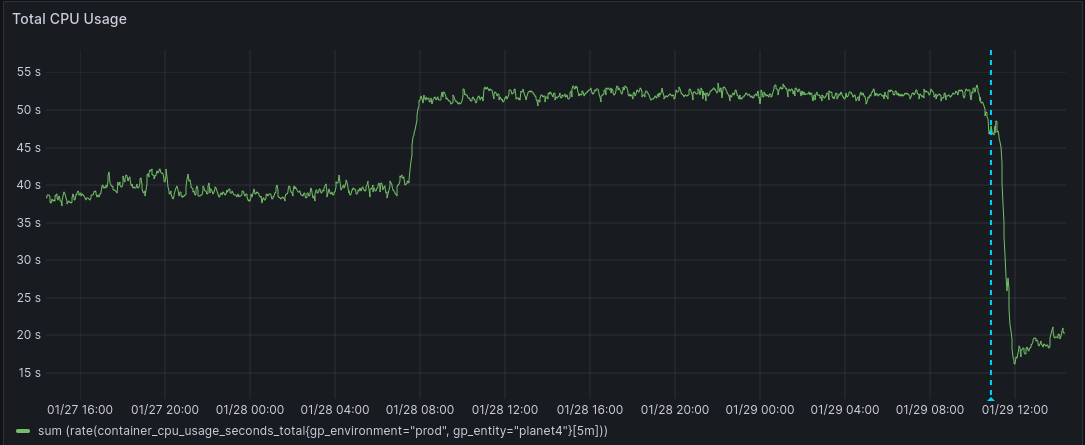
Jan 30:
By diving into the error logs we found a correlation specifically between a specific service writing to the disk and the CPU usage spikes. Furthermore we saw that this was related to the service we use to simplify running containers, called dockerize.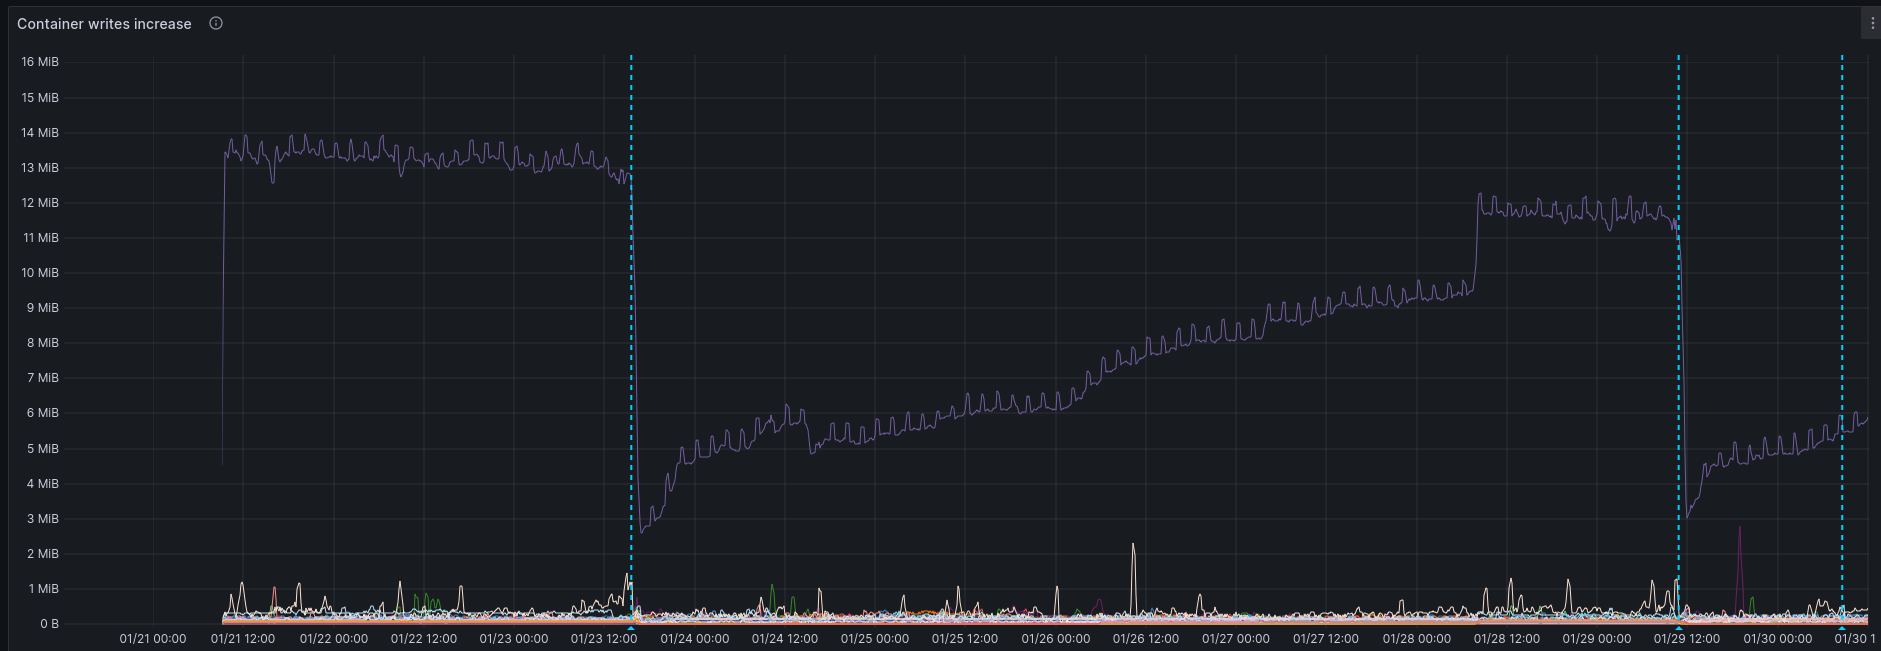
We tested reverting the dockerize service to the older version on a few sites and saw some positive effects.
Jan 31
All websites were redeployed with the old version of dockerize and we could start analyzing the CPU usage and error logs again for the coming days.
It felt good to see the decrease of all PHP errors in our logs.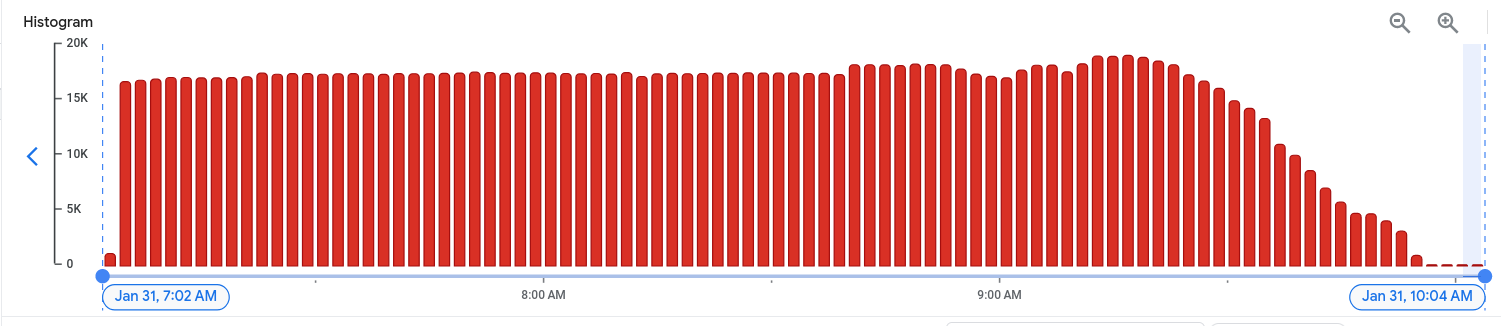
Feb 19
After more than two weeks the CPU usage is still as expected while before it was ever gradually increasing. So on to new adventures.
Internal Post-Incident Review
This report was written for internal use and is a bit more technical and focused on SRE practices improvements.
How were we first notified?
Alerts fired on Prometheus pods crash looping on some nodes in the P4 cluster. After inspection it was clear that the resource usage was far too high and that there was a bigger issue.
It took some investigation to understand what the issue was, and we shouldn’t rely on other services’ health checks alerting us if there is something wrong with the cluster.
P4 releases are deployed to dev first, but due to the nature of the incident (no real traffic in dev), the P4 team was not alerted to the issue before it reached production.
How could we have known about this?
These are events we can measure for and probably should have been alerted on:
- Sharp increase in cluster resource usage (both cpu and memory)
- Before sentry database reaches capacity (either percentage based or based on rate)
- Sentry availability (we have no alerts)
- Sentry metrics and consumers latency (no alerts currently)
- Sharp increase of SlowProbes overall
- Sharp increase of error logs in loki
How could we prevent this in the future?
This incident doesn’t have an easy solution for prevention, but there are a few things we could consider:
- Staggered deployments w/ more Observability – we could stagger our P4 production releases to observe their effects should they introduce unforeseen behaviour.
This is already possible from the CircleCI workflow, but it would make sense to use groupings. - We could add a canary deployment or mimic traffic to staging before we deploy to production.
- Insights on resources and probe latency for the P4 team. This can show some insights during deployments.
What other improvements can we make?
- Earlier cross-team collaboration. It would have benefited our investigation if the SRE and P4 teams met earlier during the incident to work together. We could create a planet4 incident workbook on steps to follow which helps us with this.
- Smaller P4 upgrades, with decoupled changes.
- We could create an alert when there is an excessive amount of SlowProbes which could not be a planned cronjob, redeployment or cache generation (issue created).
- Improved resource allocation for all P4 workloads. This will improve the auto-management of workloads in the cluster (3 issues created).
- Migrate the Horizontal Pod Autoscaler to v2 and review the scaling spec. This will improve the auto-management of workloads in the cluster (issue created).
- Knowledge exchange between SRE and P4-devs with sessions, runbooks and documentation (issue created).
- Start writing blog posts on incident response in the handbook (issue created)
- We could look into stress-testing on dev or staging that we can toggle on/off.
- Look into probe monitoring and if it skips cloudflare cache
- Make it easier for SRE colleagues to join Planet4 incident response with knowledge transfer and documentation
What went well?
- Rollback CI was very handy
- Metrics are there (at least for SRE)
- Collaboration was awesome
- Cloudflare cache help for the incident to get mostly unnoticed for end users